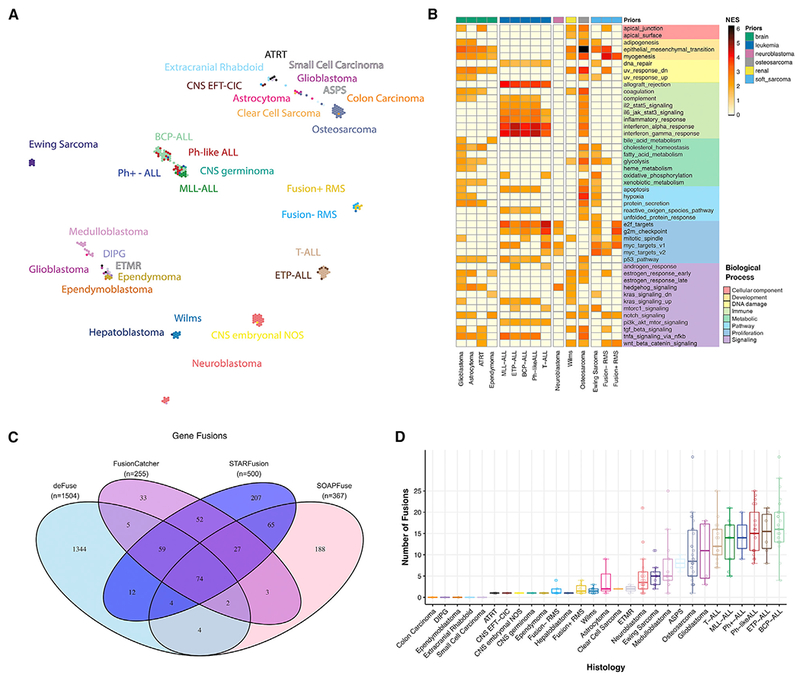
Figure 5. Expression Profiles of PDX Models Cluster by Histology and Contain Driver Fusions.

(A) TumorMap rendition of PDX RNA-seq expression matrices by histology.
(B) Gene set enrichment analysis for Hallmark pathways for histologies with n ≥ 4 samples demonstrates histology-specific biologic processes significantly altered (adjusted p < 0.05 and NES > 2.0, N = 221). Samples were grouped by prior before GSEA (nbone sarcoma = 10, nbrain = 58, nleukemia = 90, nneuroblastoma = 35, nosteosarcoma = 36, nrenal = 14, nsoft sarcoma = 18).
(C and D) Venn diagram of RNA fusion overlap among four algorithms (C) and high-confidence fusion totals (D) demonstrates a higher overall number of fusions in hematologic malignancies (boxplots are graphed as medians with box edges as first and third quartiles; detailed Ns in Table S3). n = 244 RNA samples used as input, and all n’s represent biological replicates.
