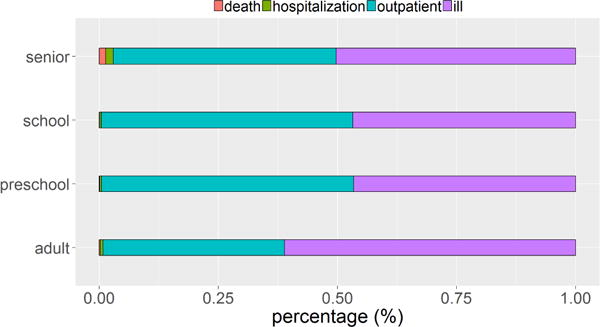
Fig. 5.

Count distribution of death (first from left in red), hospitalization (second from left in green), outpatient (third from left in blue), and ill but not seeking medical care (forth from left in purple), among the infected cases in each age group. For each age group, the percentage of death count is the smallest.
