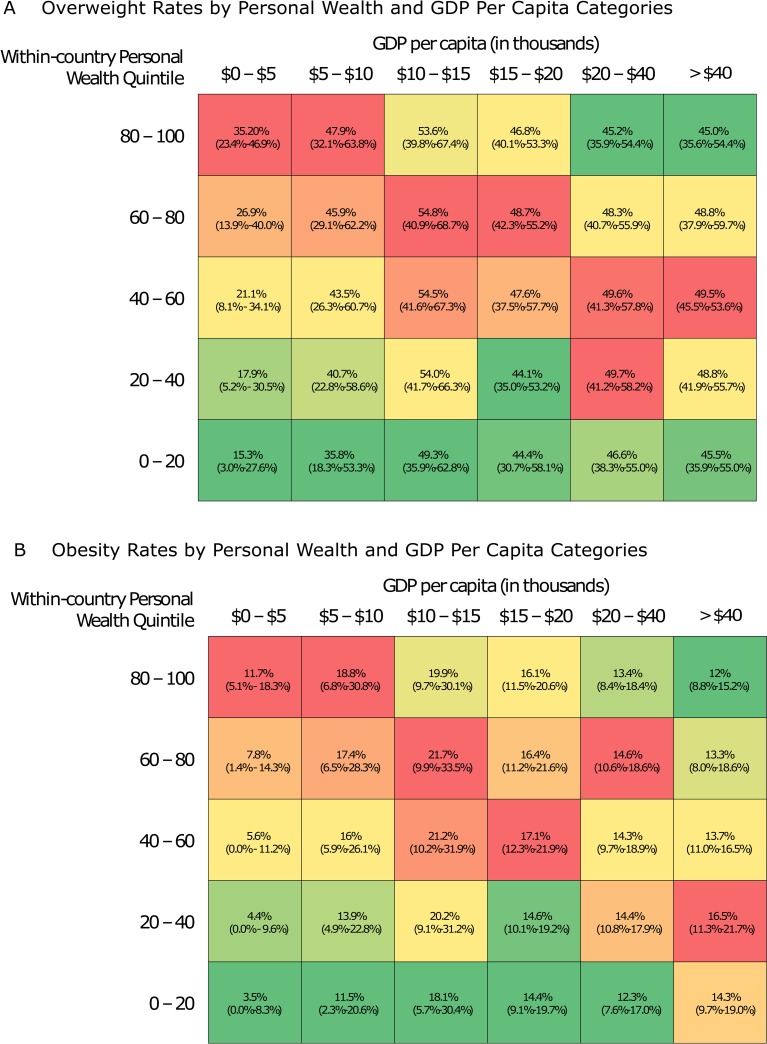
Fig 1. Overweight and obesity prevalence rates by economic development and within-survey wealth decile.
Unadjusted overweight (1A) and obesity (1B) prevalence obtained directly from survey data, stratified by GDP per capita and within-survey personal wealth decile. The columns represent GDP per capita categories, and the rows represent deciles of within-country wealth. Within each GDP per capita category, deciles with the lowest prevalence are coded in green, and deciles with the highest prevalence are coded in red. All prevalence estimates were obtained using survey weights. GDP, gross domestic product.

