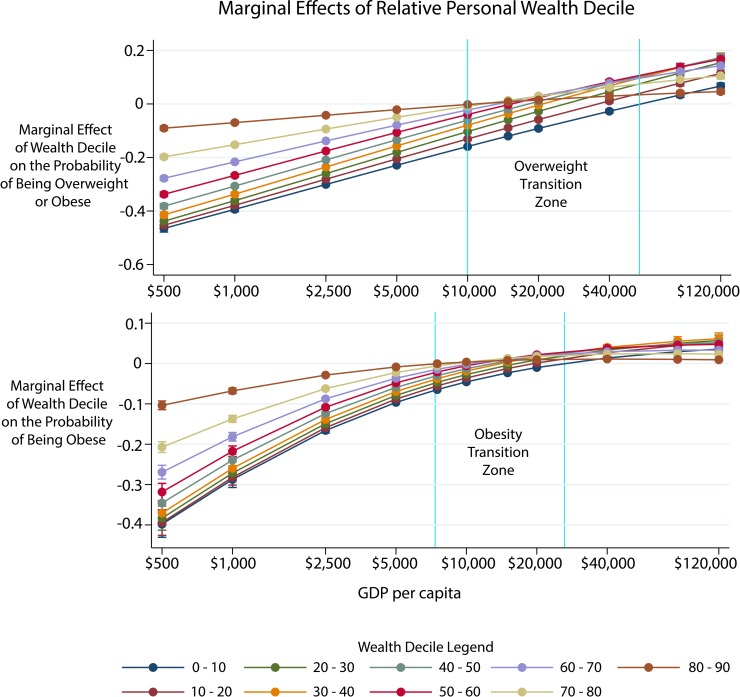
Fig 2. Differential effect of wealth on overweight and obesity by GDP per capita.
Each point represents the probability of being overweight (2A) or obese (2B) relative to the richest decile (90th–100th percentile) at different GDP per capita cutoffs. Each error bar represents robust 95% confidence intervals. The lines are color coded by wealth decile. The wealth-overweight and wealth-obesity transition zones are denoted by the vertical lines. The first line marks where the richest decile was no longer the most likely to be overweight or obese. The second line marks where the richest decile was less likely than the poorest to be overweight or obese. We evaluate the change in the gradient based on where the other percentiles are statistically significantly greater than zero (which means the wealth group has a higher chance of obesity than the 90th–100th percentile personal wealth income group). GDP, gross domestic product.

