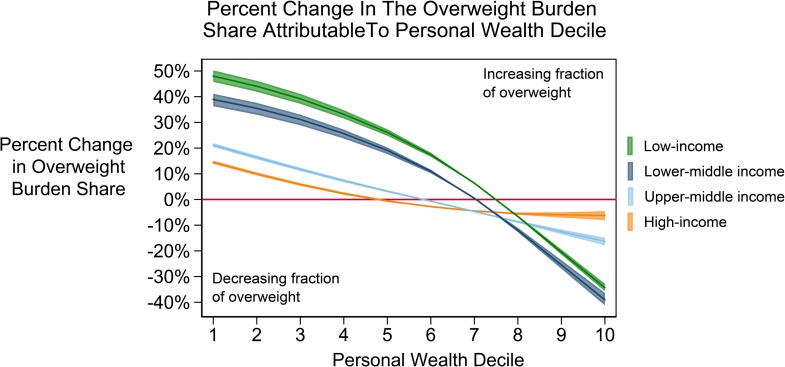
Fig 3. Change in the wealth distribution of the overweight population between 1995 and 2040.
Each line displays World Bank Income group changes in overweight burden across a wealth decile. Wealth deciles, where 1 is the poorest and 10 is the richest, are displayed on the x-axis. The percent change in each wealth decile's overweight burden share from 1995 to 2040 is on the y-axis.

