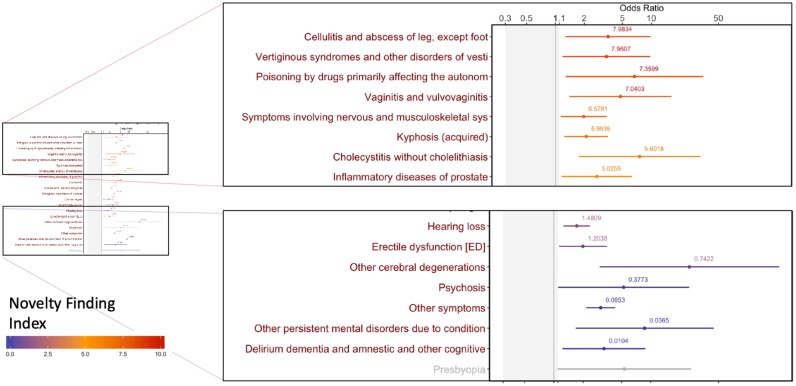
Fig 4. Significant associations 0–5 years before a diagnosis of Alzheimer’s disease presented as an odds ratio plot.
Each dot represents the point estimate of the odds ratio computed from a logistic regression and the line indicates its 95% confidence interval. Each condition is color coded by its novelty finding index, the value of which is displayed above the confidence interval.

