
Fig 5. Inter-annual trends in dengue incidence in Vietnam.
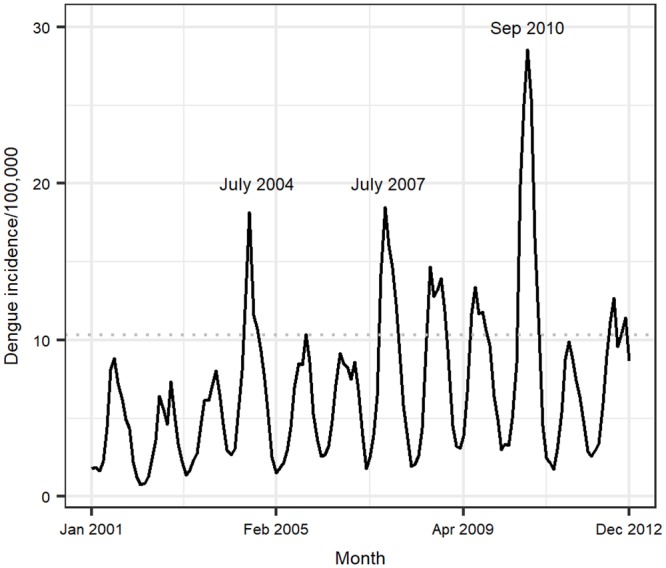
Months that had higher than expected peaks in the disease incidence are indicated in text within the graph. The horizontal dotted line at an incidence of 10.31 a threshold that was used to demonstrate changes in the peak incidence of the disease before and after mid-2005.