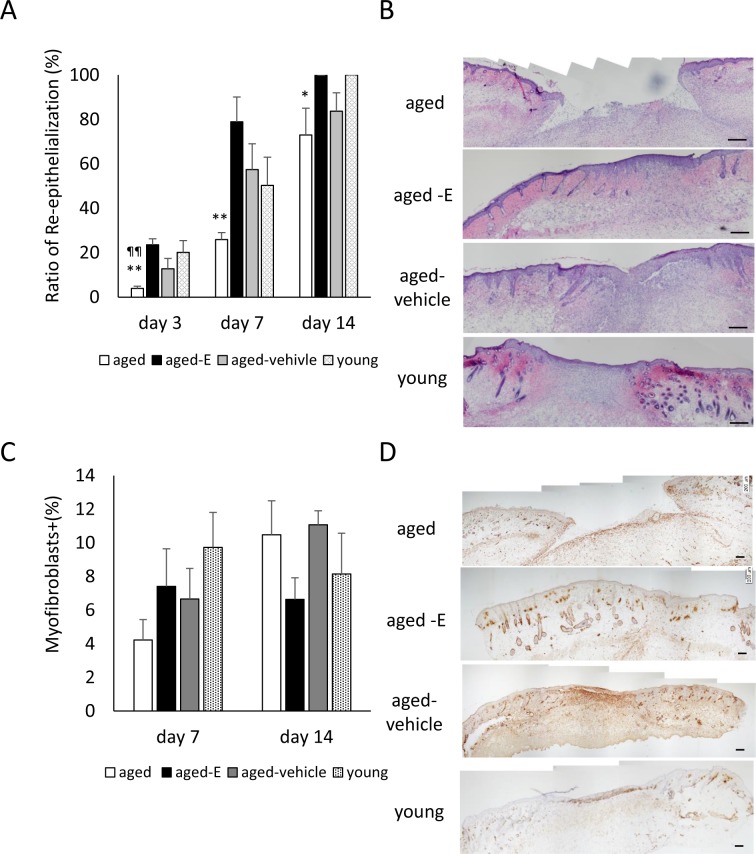
Fig 2. Re-epithelialization and wound contraction.
Box graphs show (A) ratio of re-epithelialization (%) and (C) ratio of myofibroblasts (%). (B) HE staining (scale bar = 200 μm) and (D) myofibroblasts stained with anti-α-SMA antibody (scale bar = 200 μm) were observed in granulation tissue on day 14. Values are expressed as mean + SEM, n = 4–8 wounds for each group, ANOVA, Tukey–Kramer *p<0.05 and **p<0.01: vs. aged-E group; ¶p<0.05 and ¶¶p<0.01 vs. young group.

