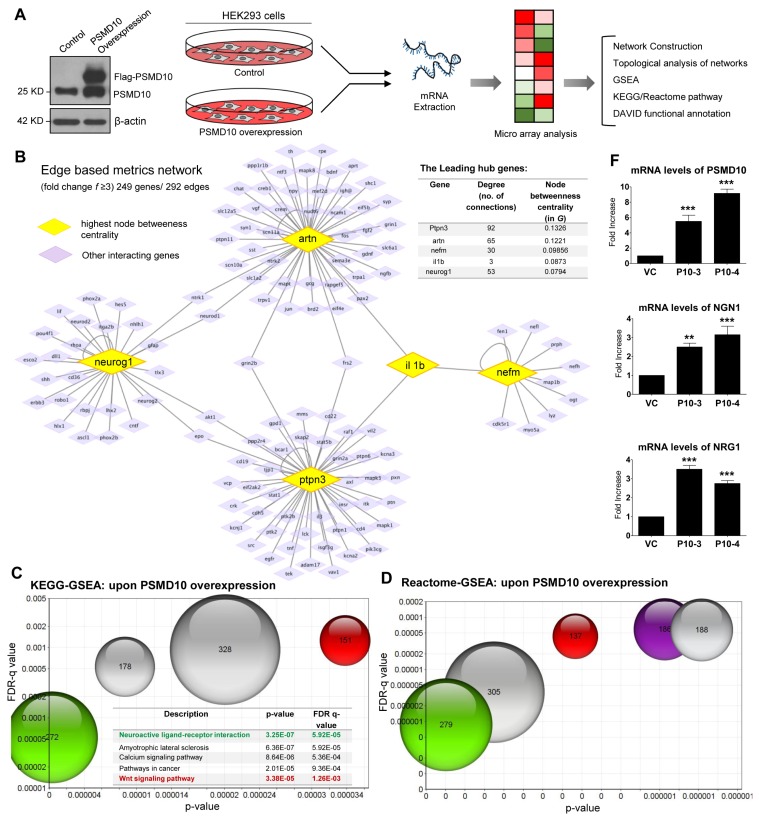
Fig. 1.
Microarray and Network analysis of HEK293 cells upon PSMD10Gankyrin overexpression. (A) Workflow for Microarray and bioinformatics analysis upon PSMD10Gankyrin overexpression in HEK293 cells. The anti-PSMD10Gankyrin WB image shows the expression of Flag-PSMD10Gankyrin and endogenous PSMD10Gankyrin from the lysates of control and overexpressed PSMD10Gankyrin HEK293 cells. (B) Network depicts the role of the top five genes possessing the highest node betweenness centrality (yellow diamond), for overexpressed PSMD10Gankyrin in HEK293 cells. Only interactions of the "other" genes (purple diamond) with these five most "between" genes is shown. Mutual interactions among these "other" genes is excluded. Interestingly, this network shows few "other" genes interacting simultaneously with two "between" genes. Further, none of the "other" genes interacts simultaneously with three of the most "between" genes. The insert table shows the value of degree and Node betweenness centrality for the top five genes. (C) The GSEA set of genes were analyzed in KEGG pathway analysis. The bubble chart depicting the topmost pathways (with highest p-values and FDR q-values) altered upon overexpressed PSMD10Gankyrin. Each bubble represents a pathway with gene number involved and had appeared in the GSEA gene set. In the table the above pathways are represented in the same color as the bubble colors along with the p-value and FDR q-value. (D) The overrepresented genes were queried against the Reactome pathway within GSEA and are depicted in the bubble chart. Five bubbles (starting from “Genes involved in Neuronal System” in the table) depict the pathways with highest p-values and FDR q-values altered upon overexpressed PSMD10Gankyrin. Each bubble represents a pathway with number genes as appeared in the GSEA gene set. The table represents the top 8 pathways with corresponding p-value and FDR q-value highlighting the neuronal pathways in the same color as the bubble color. (E) Table shows the list of top neuron specific genes which are significantly upregulated upon PSMD10Gankyrin overexpression in HEK293 cells as determined by microarray. Overexpression of PSMD10Gankyrin in stable clone as compared to the vector control cells is included as a reference. (F) Bar graphs shows validation of microarray data by real time PCR for Ngn1 and Nrg1 genes. PSMD10Gankyrin levels in stable clone as measured by real time PCR is also shown. Data represents the average fold increase of mRNA levels (normalized with GAPDH) from three independent experiments. The bubble chats were prepared by online tool https://www.onlinecharttool.com.


