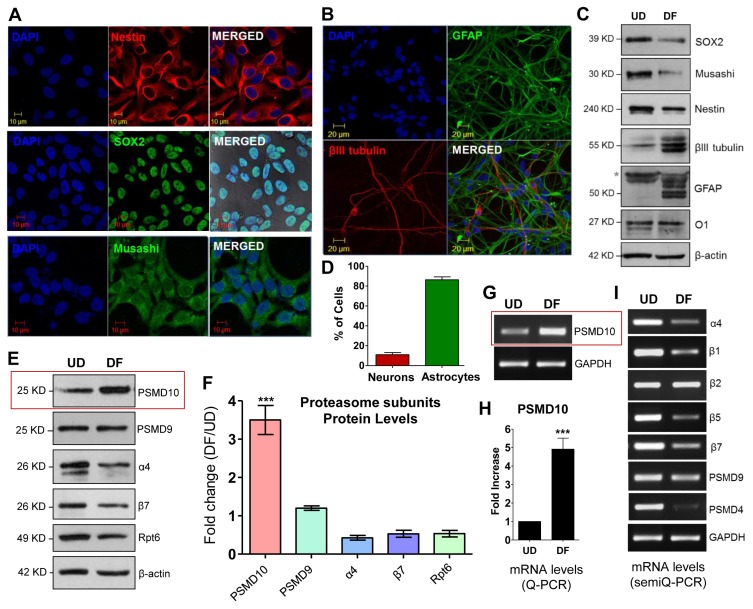
Fig. 2.
Differentiated human neural progenitor cells (hNPCs) shows higher expression of PSMD10Gankyrin. (A) Progenitor cells were cultured on laminin coated glass coverslips to ~80% confluence. Immunofluorescence was performed following the protocol described in materials and methods. Cells stained positive for Nestin (in red) Sox2 (in green), Musashi (in green) and DAPI (nuclear stain; in blue). Images were acquired in a Laser confocal microscope (Zeiss LSM meta-510). (B) Progenitor cells were grown as described and differentiated using differentiation media. Media was changed every alternative day. Cultures were processed for further experiments on the 12th day of differentiation. Immunofluorescence was performed following the protocol described in materials and methods. Cells stained for β-III tubulin (in red), and GFAP (in green) indicating the formation of neurons and astrocytes respectively. (C) Cell lysates of hNPCs and differentiated cells were subjected to WB. Image shows the expression of stem cell and differentiation markers in the progenitor cells (UD) and differentiated cells (DF) respectively. (D) The bar graph represents the percentage of neurons and astrocytes differentiated from above experiments (Fig. 2B). Data represents average of the percentage of cells from three independent experiments, each counted from 12 different fields (12×3=36 microscopic fields). (E) WB images of cell lysates of hNPCs and differentiated cells show expression of PSMD10Gankyrin and other proteasomal subunits in the progenitor cells (UD) and differentiated cells (DF). (F) The bar graph represents the quantification of proteasomal subunits protein level expression counted from above experiments (Fig. 2B) in fold change (from three independent experiments with ± SEM) in DF cells compared to UD cells after normalizing with β-actin. (G) Semi-Q PCR gel image shows the mRNA levels of PSMD10Gankyrin in the progenitor cells (UD) and differentiated cells (DF). (H) Graph represents mRNA levels of PSMD10Gankyrin in the progenitor cells (UD) and differentiated cells (DF) measured by the Real-time PCR. Data represents the average fold increase of mRNA levels (normalized with GAPDH) of three independent experiments with ± SEM. (I) Semi-Q PCR gel image shows the mRNA levels of proteasomal subunits in the progenitor cells (UD) and differentiated cells (DF).

