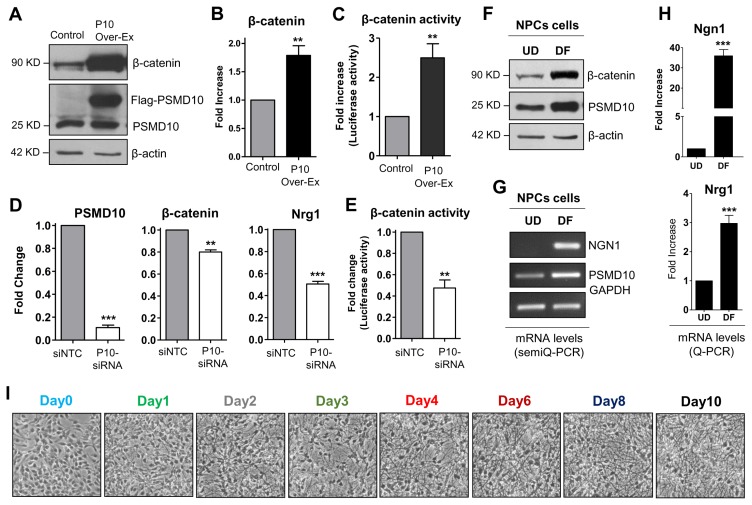
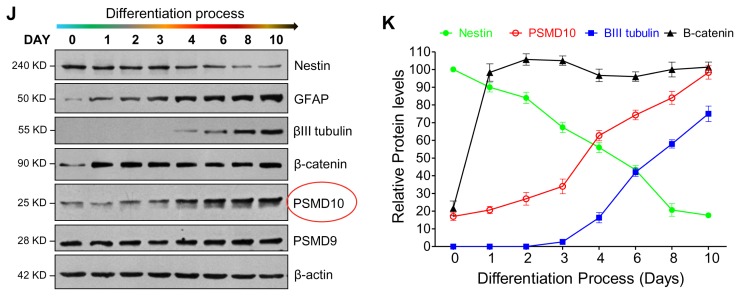
Fig. 3.
PSMD10Gankyrin expression increases during the hNPCs differentiation process. (A) PSMD10Gankyrin Stable clone (P10 Over-Ex) in HEK293 cells were analyzed for PSMD10Gankyrin and β-catenin protein levels by western blot. (B) The graph shows the real-time PCR analyzed, significant increase in mRNA levels of β-catenin in the PSMD10Gankyrin overexpression clone with the error bar corresponding to the ±SEM of two independent experiments done in duplicates. GAPDH is used as loading control and for normalization. (C) PSMD10Gankyrin Stable clone and control HEK293 cells were transfected with TopFlash and renilla constructs at a ratio of 10 : 1 respectively and were lysed 48 hr post-transfection. Graph shows the average fold increase with ±SEM in β-catenin transcriptional activity normalized with renilla luciferase activity from two independent experiments done in duplicates. (D) HEK293 cells were transfected with PSMD10Gankyrin siRNA/control siRNA and were grown for 48 hr then RNA was isolated. The three graphs show the real-time PCR analyzed significant decrease in mRNA levels of PSMD10Gankyrin, β-catenin and Nrg1 with the error bar corresponding to the ±SEM of duplicate experiments. GAPDH is used as loading control and for normalization. (E) HEK293 cells were transfected with PSMD10Gankyrin siRNA/control siRNA, incubated for 48 hr and then transfected with TopFlash and renilla construct at a ratio of 10 : 1 respectively and were lysed 24 hr post-transfection. Graph shows the average fold change with ±SEM in β-catenin transcriptional activity normalized with renilla luciferase activity from duplicate experiments. (F) Neural Progenitor cells grown on laminin coated plates to ~80% confluence were differentiated as described in Fig. 2 with a minor change; differentiation was stopped at day 10. WB images of cell lysates of hNPCs and differentiated cells show expression of PSMD10Gankyrin and β-catenin in the progenitor cells (UD) and differentiated cells (DF). (G) Semi-Q PCR gel image shows the mRNA levels of PSMD10Gankyrin and Ngn1 in the above mentioned progenitor cells (UD) and differentiated cells (DF). (H) Graphs represents mRNA levels of Ngn1 and Nrg1 in the progenitor cells (UD) and differentiated cells (DF) measured by the Real-time PCR. Data represents the average fold increase of mRNA levels (normalized with GAPDH) of three independent experiments with ±SEM. (I) Phase-contrast images show day wise differentiation status of the hNPCs. (J) Cells at each day of differentiation were collected, lysed and analyzed by western blot using antibodies mentioned in the figure. (K) Line graphs show the expression levels of various proteins from Fig. 3J at each day during the differentiation process. Data represents the average protein levels of two independent (biological repeat) experiments.


