Fig. 4.
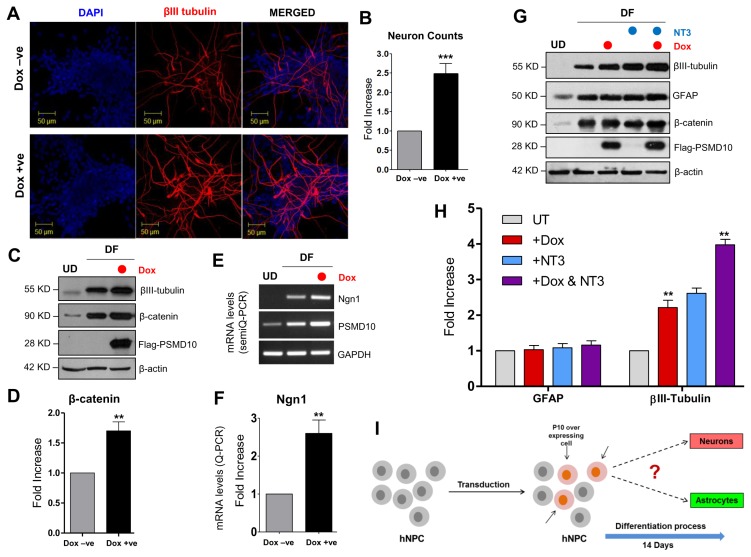
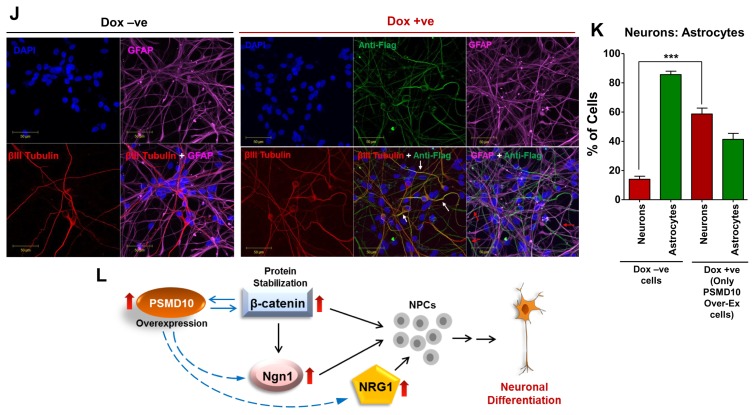
PSMD10Gankyrin overexpression in hNPCs facilitate neuronal differentiation process. hNPCs were grown on laminin coated glass coverslips till they reached ~30% confluency. Then cells were transduced with virus particles carrying pTRIPZ-3XFlag- PSMD10Gankyrin and cells were either treated with doxycycline (1 μg/mL) for 48 hr or left untreated. Once ~80% confluency was reached, media was replaced with fresh differentiation media. Subsequently, differentiation media was replaced every alternate day and contained doxycycline (1 μg/mL) or no doxycycline until the 12th day of differentiation. (A) Cells were immunostained using β-III tubulin antibody (in red) following the protocol described in materials and methods. DAPI (in blue) was used for nuclear staining. (B) The bar graph represents the fold increase in the number of neurons differentiated from hNPCs with/without overexpression of Flag-P10 in the total pool of hNPCs. Data represents average number of cells from two independent experiments (in fold increase) each from 10 different fields (10×2=20 microscopic fields). (C) WB image of the above cells shows levels of β-III tubulin and β-catenin. (D) The bar graph shows the average fold increase with ±SEM in β-catenin protein levels in differentiated hNPCs (DF) treated with/without Doxycycline. β-actin was used as loading control and for normalization. (E) Semi-Q PCR gel image shows the mRNA levels of PSMD10Gankyrin and Ngn1 in the progenitor cells (Dox-ve UD) and differentiated cells (Dox-ve DF & Dox + ve DF). (F) The realtime-PCR bar graph represents the mRNA levels of Ngn1 in the differentiated cells (cont-DF & Flag-P10 DF). Data represents the average fold increase of mRNA levels (normalized with GAPDH) of three independent experiments. (G) hNPCs cells were either treated with Doxycycline and/or 10 ng/mL NT3 or left untreated during the differentiation process (for 10 days) and cell lysates were prepared for WB. Image shows levels of β-III tubulin, β-catenin and FLAG- PSMD10. (H) The bar graph shows the protein level quantification of GFAP and β-III tubulin with average value ±SEM from three different experiments with experimental set-up explained in Panel-I. β-actin was used as loading control and for normalization. (I) Model figure represents the workflow for tracing hNPCs fate after PSMD10Gankyrin overexpression. (J) Immunofluorescence was performed in above cells treated with/without Doxycycline; following the protocol described in materials and methods. In Dox + ve staining, cells (white arrow marked) expressing Flag-PSMD10Gankyrin (green) also stain for β-III tubulin (red). They are GFAP negative (purple). Cells (red arrow marked) expressing Flag-PSMD10Gankyrin (green) also stain for GFAP (purple). (K) Bar graph represents the percentage of neurons and astrocytes differentiated from hNPCs without and with (Dox treatment) overexpression of Flag-PSMD10Gankyrin. For Dox + ve set those cells which expressed Flag-PSMD10Gankyrin were only considered for neuron and astrocyte count. Data represents the average number of cells (in percentage) from three independent experiments, with data collected from 10 fields in each case (10×3=30 microscopic fields). (L) Model figure based on previously reported role of Ngn1 and results from the current study shows the probable role of PSMD10Gankyrin in hNPCs differentiation via β-catenin Ngn1 pathway.


