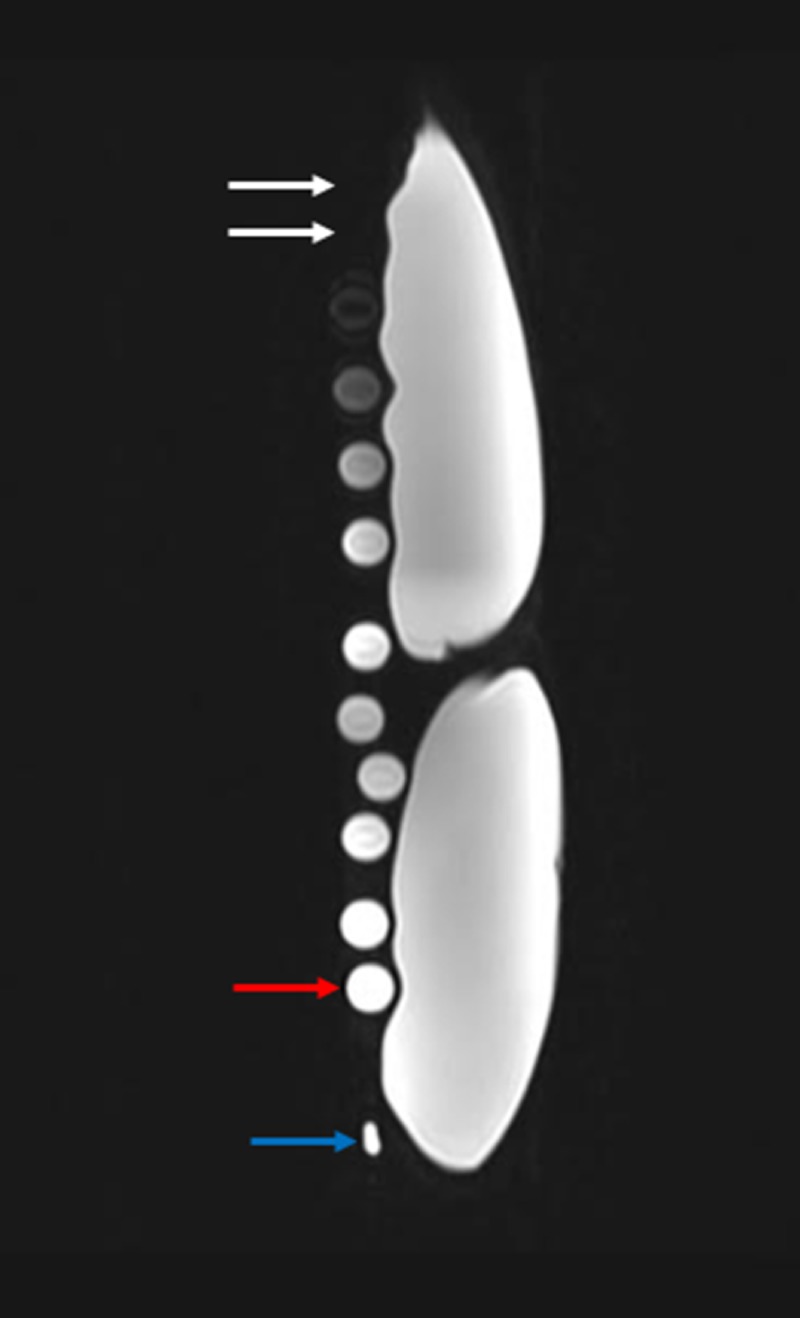
Figure 6. In vitro results of serial diluted gadolinium solution on T2 weighted magnetic resonance imaging.
The results of the in vitro experiment show the test tube with the most concentrated gadolinium solutions are not visualized, given the low signal intensity (white arrows). The test tube with the most dilute gadolinium solution (red arrow) has the highest signal intensity on T2 weighted magnetic resonance imaging. All test tube samples were imaged adjacent to two 500 milliliter bags of normal saline. The blue arrow represents the magnetic resonance imaging marker.

