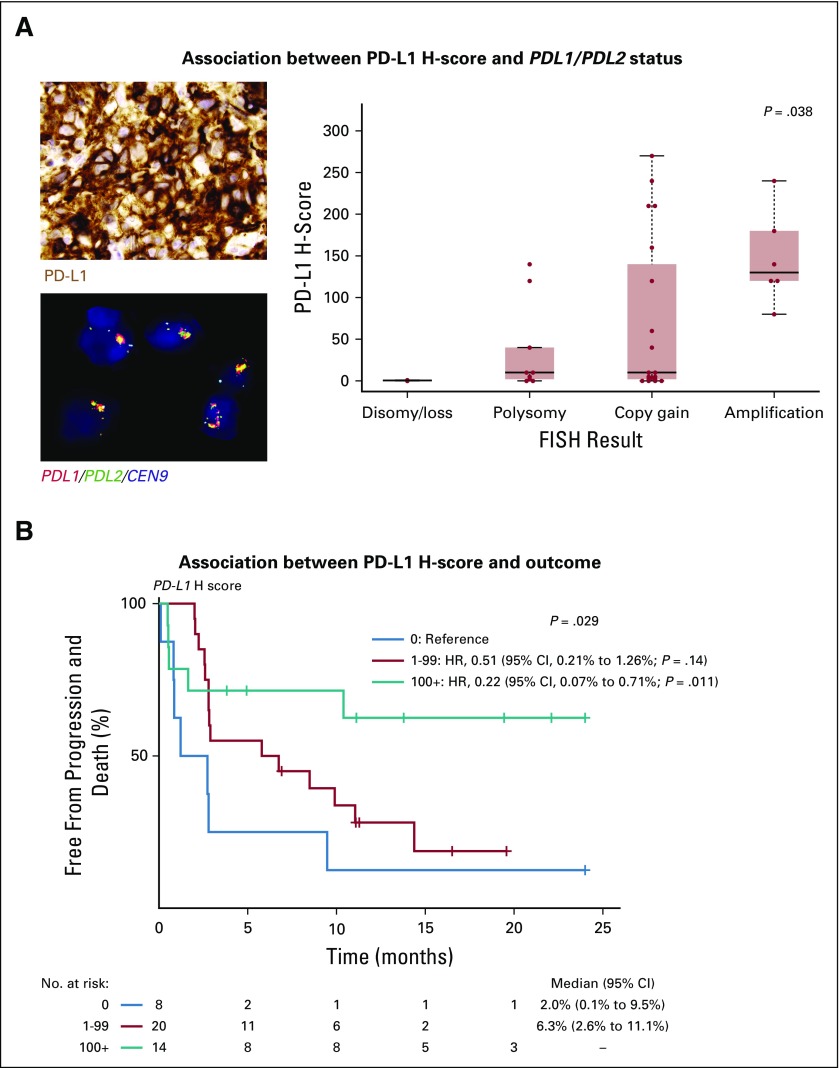
FIG 4.
Association between 9p24.1 status, PD-L1 expression, and progression-free survival. (A, left, top) Photomicrograph of a representative sample stained for programmed cell death-1 ligand (PD-L1) protein expression by chromogenic immunohistochemistry (positive staining indicated by brown coloration) and strong PD-L1 expression by the malignant cells (modified H-score, 240). (A, left, bottom) Photomicrograph of the same sample analyzed for PDL1/PDL2 copy number by fluorescence in situ hybridization (FISH; red = PDL1; green = PDL2; yellow = PDL1/PDL2 fused; aqua = pericentromeric chromosome 9) and PDL1/PD2 amplification within nuclei of the malignant cells (classified as amplified). (A, right) Distribution of PD-L1 H-scores across 36 patients (excluding rearrangements) according to PDL1/PDL2 status. P = .038 was determined by the Kruskal-Wallis rank-sum test. (B) Progression-free survival of 42 patients for whom PD-L1 H-score was determined and divided according to those with an H-score of 0 (blue line), H-score of 1-99 (red line), and H-score of ≥ 100 (green line). P = .029 was determined by the log-rank test. Cox regression with hazard ratios (HRs), 95% CIs, and Wald P values are also shown using patients with an H-score of 0 as the reference.

