
Figure 1.
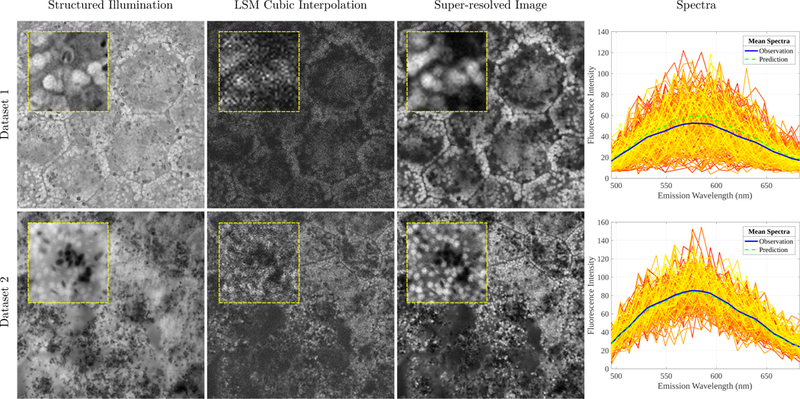
Results from two datasets (rows 1 and 2) of co-registered LSM and SIM images. Column 1: The high-resolution SIM image. Column 2: A reference channel of the LSM image upsampled with cubic interpolation. Column 3: The super-resolved image using the proposed framework. Best case reference channels are shown. Yellow-framed insets show improved resolution using the proposed framework. Column 4: Raw observed spectra from segmented granules showing a high degree of noise. Their mean spectra are reported in blue and the mean prediction of the model is shown in green.