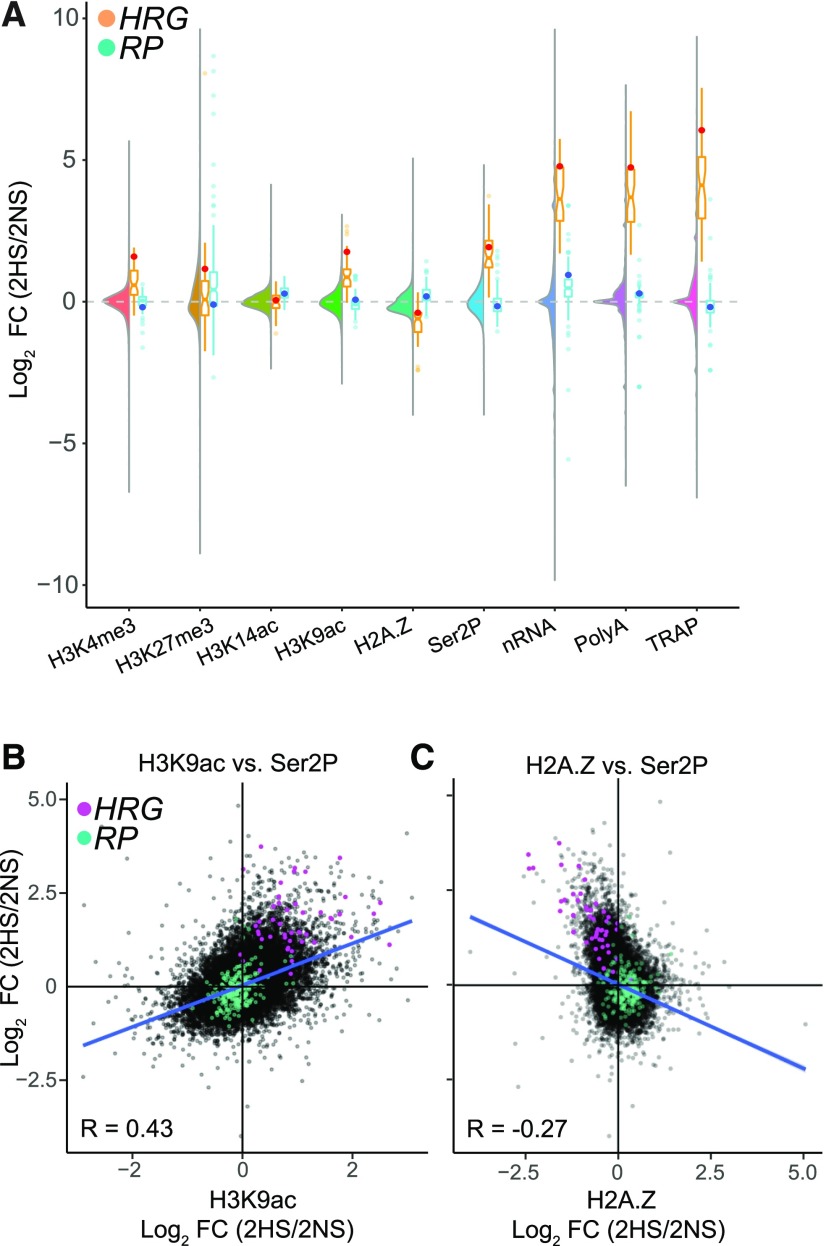
Figure 3.
Short-Term HS Promotes Pronounced Changes in Chromatin, Transcription, and Nascent Transcripts that Are Not Uniformly Reflected in Transcript Steady-State Abundance or Translation
Comparison of genome-wide data for chromatin and RNA for 2HS relative to 2NS.
(A) Combined violin and boxplot of log2 FC (2HS/2NS) of histone, RNAPII–Ser2P, and RNA outputs. Violin plot, all genes; boxplot for the HRGs plotted in orange with ADH1 depicted as a red dot and the cytosolic RPs plotted in blue, with RPL37B depicted as a dark blue dot.
(B) Comparison of log2 FC (2HS/2NS) between H2A.Z on the gene body and Ser2P on the gene body.
(C) Comparison of log2 FC (2HS/2NS) between H3K9ac and Ser2P on the gene body.
For (B) and (C), HRGs are plotted in pink and RPs in blue; Pearson’s coefficient of determination is shown for all genes.

