Figure 4.
Multiscale Analysis of Hypoxia-Regulated Genes Reveals Concordant and Discordant Patterns of Gene Regulation
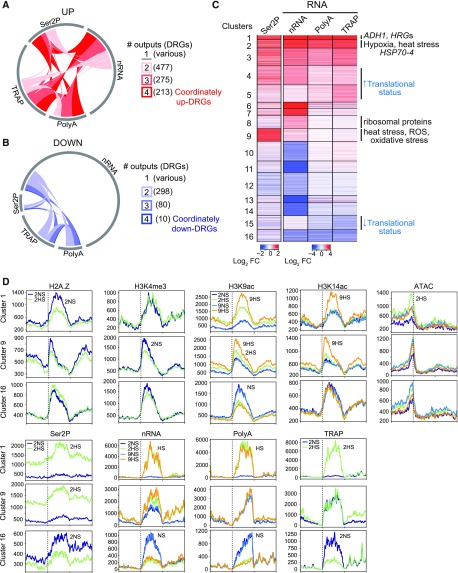
Number of (A) up- and (B) down-RGs in response to 2 h of HS (|log2 FC| > 1; FDR < 0.05) identified in each of the four readouts related to RNA: Ser2P ChIP, nRNA, polyA RNA, and TRAP RNA. Arc of circle circumference indicated by the gray line represents the DRGs in each of the four readouts. Genes differentially regulated in two to four readouts were tabulated (number in parentheses) and depicted by links within the circle. Genes differentially regulated in only one readout are represented by unlinked gray lines.
(C) Heatmap showing similarly regulated genes based on four assays of gene activity. Partitioning around medoids clustering of 3,042 DRGs for the identification of cluster members and centers; 16 clusters. Selected enriched GO terms are shown on the right (P adjusted < 1.47e-09), |log2 FC| > 1, FDR < 0.05. Clusters displaying increased or decreased translational status (ribosome-associated [TRAP] relative to total abundance [polyA]) are shown.
(D) Average signals (RPKM * 1,000) of various chromatin and RNA outputs for genes of three clusters plotted from 1 kb upstream of the TSS to 1 kb downstream of the TES for the 2 h (2NS, 2HS) and 9 h (9NS, 9HS) time points. Signal scale of the graphs differ.

