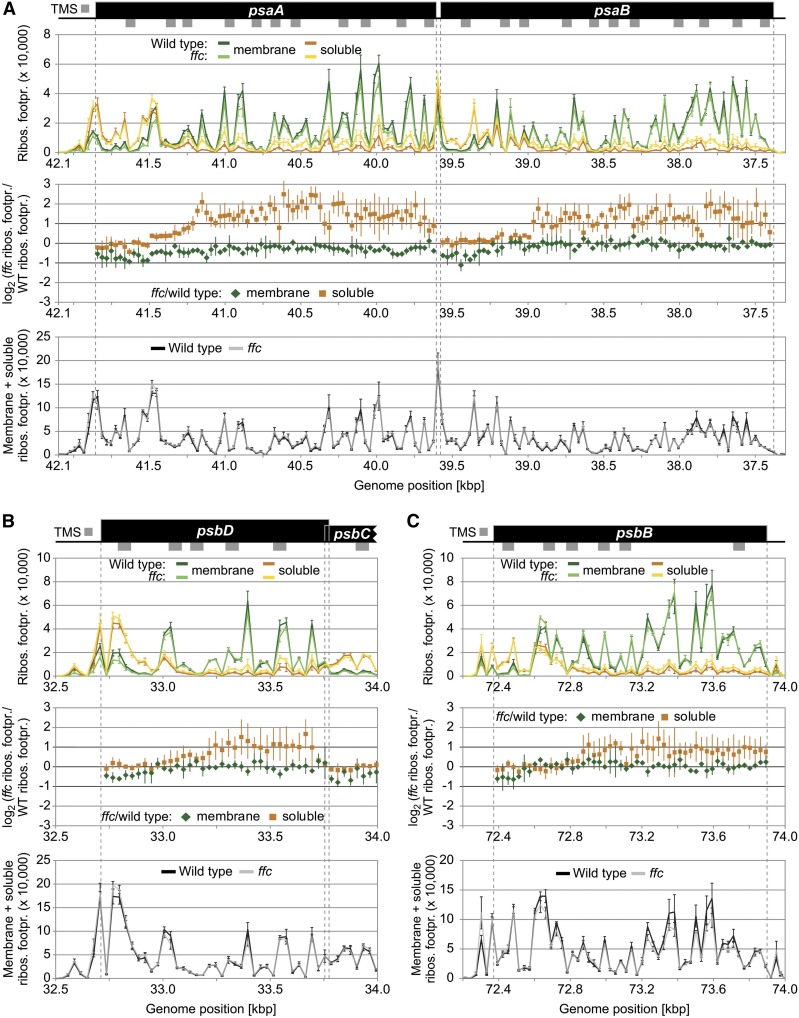
Figure 3.
Zoom-In Images for Reading Frames That Display Substantially Altered Soluble Ribosome Footprint Abundances in the ffc Mutant.
(A) to (C) Zoom-in images of ribosome footprint distributions and translation output in the psaA/B (A), psbD (B), and psbB (C) coding regions. From top to bottom: Gene maps with TMSs represented by gray rectangles below the coding regions (black boxes). TMS positions are based on the Aramemnon plant membrane protein database (Schwacke et al., 2003). (Top) Ribosome footprint abundances from membrane and soluble fractions (green and orange lines, respectively) from the wild-type and ffc mutant plants (dark and light colors, respectively) plotted against genome position according to the gene map. (Middle) Log2-transformed ratio of ribosome footprint abundances in the ffc mutant compared with the wild type for membrane-associated and soluble footprints (green diamonds and orange squares, respectively) as shown in Figure 2B. Note that these ratios were only calculated for probes that are located in protein-coding regions and that gave a ribosome footprint signal that passed the threshold of 200 above background. (Bottom) Weighted sums of membrane and soluble ribosome footprint abundances for the wild type (black line) and ffc mutant (transparent gray line) as shown in Figure 2C. In all diagrams, vertical lines represent sds that are based on three independent biological replicates. Dashed gray vertical lines mark the boundaries of protein-coding regions. The psbD and psbC reading frames are overlapping. Note that several regions in the shown reading frames display substantially increased levels of soluble ribosome footprints in the ffc mutant (i.e., more than twofold change for at least two consecutive probes), while the translation output and ribosome distribution within the reading frames are unaltered. Footpr., footprint; Ribos., ribosome; WT, wild type.

