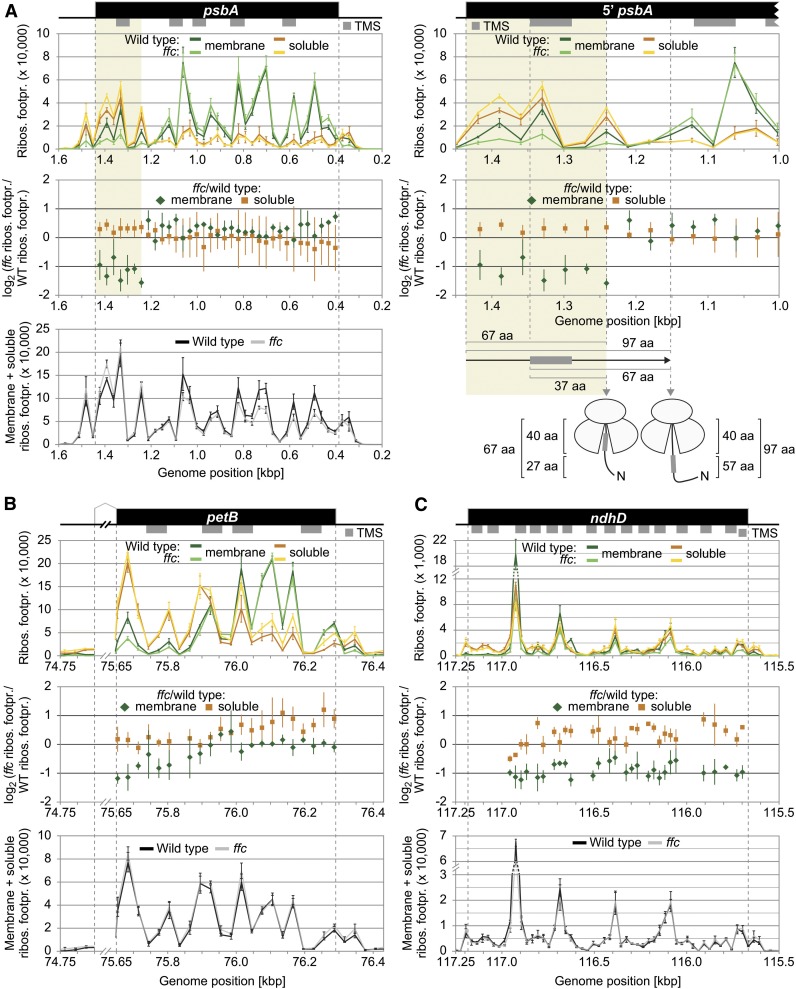
Figure 4.
Zoom-In images for Reading Frames That Display Substantially Altered Membrane-Associated Ribosome Footprint Abundances in the ffc Mutant.
(A) to (C) Zoom-in images of ribosome footprint distributions and translation output in the psbA (A), petB (B), and ndhD (C) coding regions. Data representation and annotations are as in Figure 3. The petB reading frame is interrupted by an intron whose size was reduced for better illustration by breaking the x axes. Note that several regions in the shown reading frames display substantially decreased levels of membrane-associated ribosome footprints in the ffc mutant (i.e., <0.5-fold change for at least two consecutive probes). The region that shows substantially decreased levels of membrane-associated ribosome footprints in psbA is shaded in ocher, and a zoom in of this region is shown on the right for the map and the two diagrams on top. Vertical gray dashed lines in this zoom in illustrate from left to right the start codon of psbA, the start of the first TMS, the end of the region that shows decreased membrane-associated ribosome footprints, and the point at which psbA translation shows stable engagement with the thylakoid membrane. Distances from the start codon or the start of the first TMS to the end of the region whose translation is spatially altered and the point of stable engagement are given in amino acids (aa) below the diagrams. The model illustrates that the region that shows decreased membrane-associated ribosome footprints is translated before exposure of the first TMS outside of the ribosome exit tunnel, which accommodates ∼40 amino acids. Footpr., footprint; Ribos., ribosome; WT, wild type; N, N-terminus.

