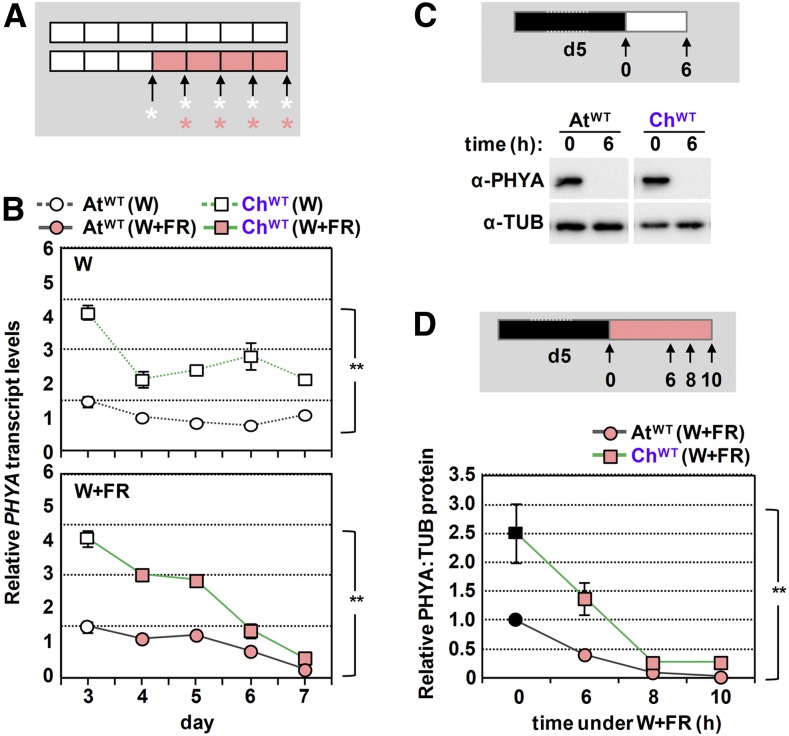
Figure 5.
C. hirsuta Seedlings Have Higher phyA Levels Than Those of Arabidopsis.
(A) Cartoon showing the design of the experiment. AtWT and ChWT, grown as in Figure 1A, were harvested at the indicated times of W or W+FR treatments (asterisks) for RNA extraction.
(B) Evolution of PHYA transcript levels in AtWT and ChWT seedlings grown as detailed in (A). Primers used (Supplemental Figure 8A) allow quantifying and comparing expression levels by RT-qPCR between both species. PHYA transcript abundance was normalized to three reference genes (EF1α, SPC25, and YLS8). Values are means and se of three independent RT-qPCR biological replicates relative to PHYA transcript levels of day-3 Arabidopsis seedlings. Two-way ANOVA showed that PHYA levels are significantly different (**, P < 0.01) between species under either W or W+FR.
(C) Immunoblot detection of phyA and tubulin with the antibodies indicated in Figure 3C in extracts of AtWT and ChWT seedlings grown as detailed at the top of the panel: 5-d-old etiolated seedlings were exposed to W light, and material was harvested before and after 6 h of W exposure (arrows).
(D) Evolution of relative phyA protein levels (PHYA:TUB) in AtWT and ChWT seedlings exposed to simulated shade, as detailed at the top of the panel: 5-d-old etiolated seedlings were exposed to W+FR light, and material was harvested before and after 6, 8, and 10 h of simulated shade exposure (arrows). Values are means and se of four independent biological replicates relative to PHYA:TUB levels of etiolated AtWT seedlings. Two-way ANOVA showed that relative PHYA levels under W+FR are significantly increased (**, P < 0.01) in C. hirsuta over Arabidopsis.

