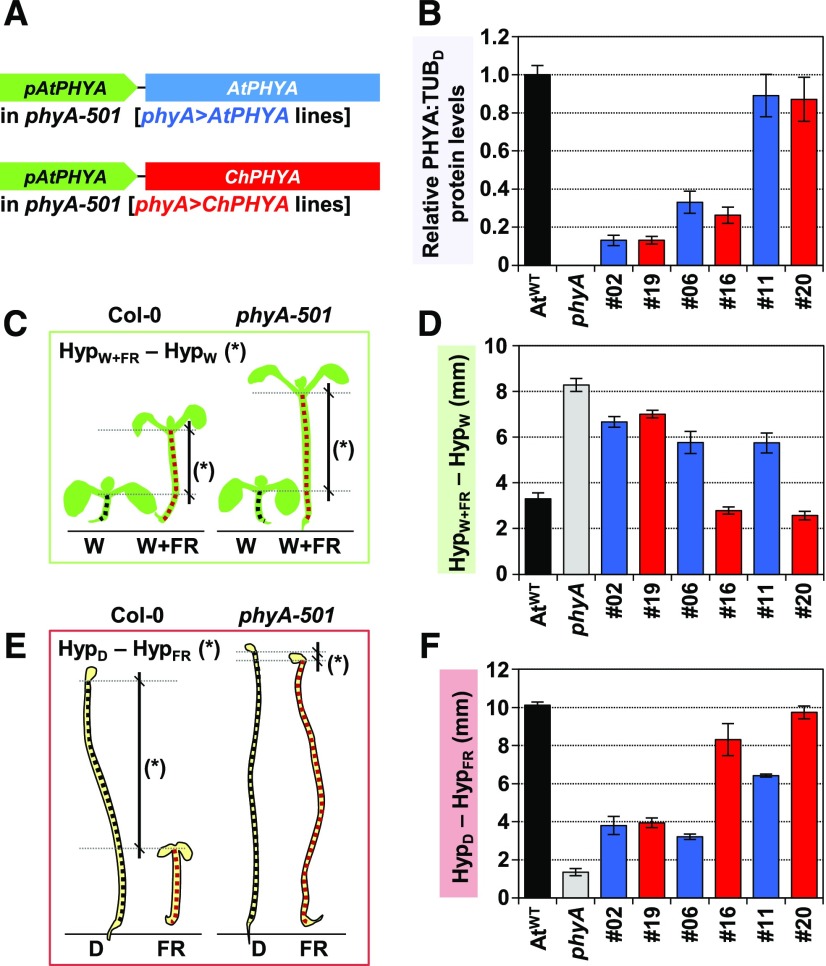
Figure 6.
ChphyA Has a Stronger Activity Than AtphyA in Repressing Shade-Induced Hypocotyl Elongation.
(A) Cartoon detailing the constructs used to complement Arabidopsis phyA-501 mutant plants.
(B) Relative PHYA:TUB in etiolated seedlings of AtWT, phyA-501, and selected phyA>AtPHYA (blue bars) and phyA>ChPHYA (red bars) complementation lines. Seedlings were grown as indicated in Supplemental Figure 8. Values are means and se of four independent biological replicates relative to PHYA:TUB levels of etiolated AtWT seedlings.
(C) Cartoon illustrating how phyA activity in simulated shade was established as differences in hypocotyl length between simulated shade- and W-grown seedlings (HypW+FR-HypW). Seedlings were grown for 2 d under W and then for another 5 d under W or W+FR (R:FR = 0.02), when hypocotyls were measured.
(D) HypW+FR-HypW in seedlings of AtWT, phyA-501, and selected phyA>AtPHYA (blue bars) and phyA>ChPHYA (red bars) complementation lines. Values are the difference of means of hypocotyl length between seedlings grown under W+FR (HypW+FR) and under W (HypW). se were propagated accordingly.
(E) Cartoon illustrating how phyA activity in deetiolation was established as differences in hypocotyl length between dark- and FR-grown seedlings (HypD-HypFR). Seedlings were grown as indicated in Figure 3B.
(F) HypD-HypFR in seedlings of AtWT, phyA-501, and selected phyA>AtPHYA (blue bars) and phyA>ChPHYA (red bars) complementation lines. Values are the difference of means of hypocotyl length between seedlings grown in the dark (HypD) and under FR (HypFR). se were propagated accordingly.
In (C) and (E), mutant phyA-501 seedlings have no phyA activity.

