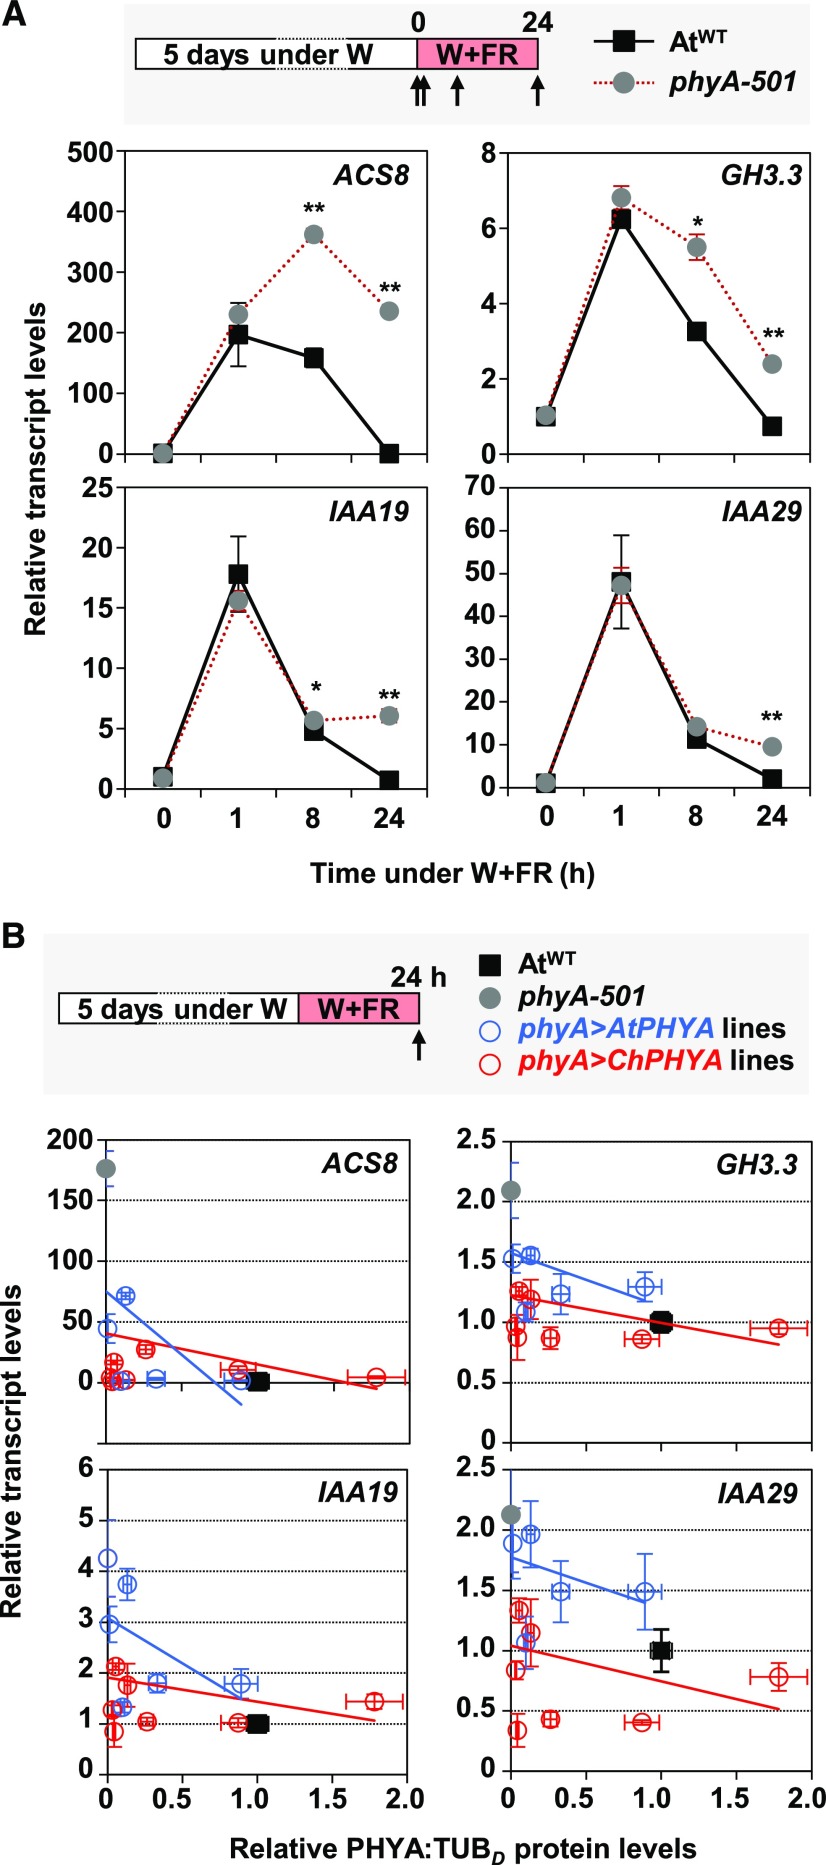
Figure 7.
ChphyA Has a Stronger Activity Than AtphyA in Repressing Shade-Induced Expression of ACS8, GH3.3, IAA19, and IAA29 Genes.
(A) Effects of phyA in the shade-induced expression of ACS8, GH3.3, IAA19, and IAA29. W-grown day-5 seedlings of AtWT and phyA-501 were treated for 0, 1, 8, and 24 h with W+FR (R:FR = 0.02), when material was harvested for RNA extraction, as indicated at the top of the panel. Transcript abundance, normalized to EF1α, is shown. Values are means and se of three independent RT-qPCR biological replicates relative to values at 0 h for AtWT. Asterisks indicate significant differences (**, P < 0.01 and *, P < 0.05) between phyA-501 and AtWT seedlings exposed for the same time to W+FR.
(B) Correlation between ACS8, GH3.3, IAA19, and IAA29 expression and relative levels of PHYA protein in the seedlings of AtWT, phyA-501, and phyA>AtPHYA (blue lines and dots) and phyA>ChPHYA (red lines and dots) complementation lines. Gene expression was quantified in W-grown day-5 seedlings exposed to W+FR (R:FR = 0.02) during 24 h, as indicated at the top of the panel. Transcript abundance was normalized to EF1α. Relative phyA protein levels (PHYA:TUB; data already shown in Supplemental Figure 8) were estimated in etiolated seedlings. Values are means and se of three independent RT-qPCR biological replicates relative to values of AtWT. The estimated regression lines for the phyA>AtPHYA (blue line) and phyA>ChPHYA (red line) complementation lines are shown for each correlation.

