Figure 3.
Phylogenetic Analysis of the WP1 Protein and Expression Pattern of WP1.
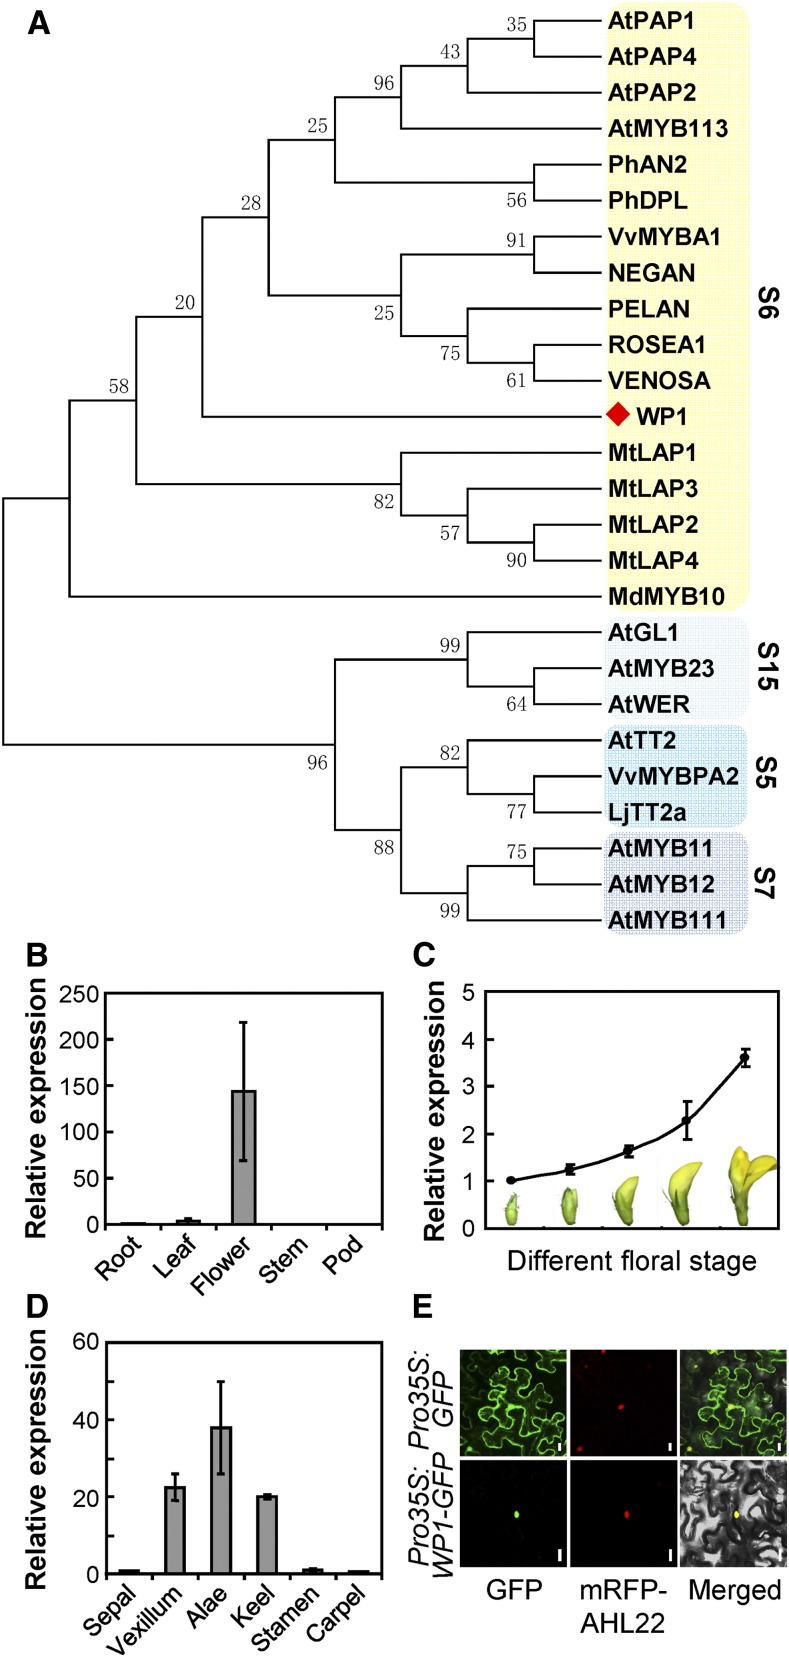
(A) Phylogenetic analysis of WP1 (marked with a red diamond) and other MYBs using R2R3 MYB domains. Subgroup (S) names are indicated on the right, and the subgroups are shaded.
(B) to (D) RT-qPCR analysis of WP1 expression in various tissues (B), different floral stages (C), and dissected floral organs (D). Bars represent means ± sd of three biological replicates.
(E) Subcellular localization of WP1-GFP in N. benthamiana leaf epidermal cells. AHL22 was used as a nuclear marker. Bars = 20 μm.

