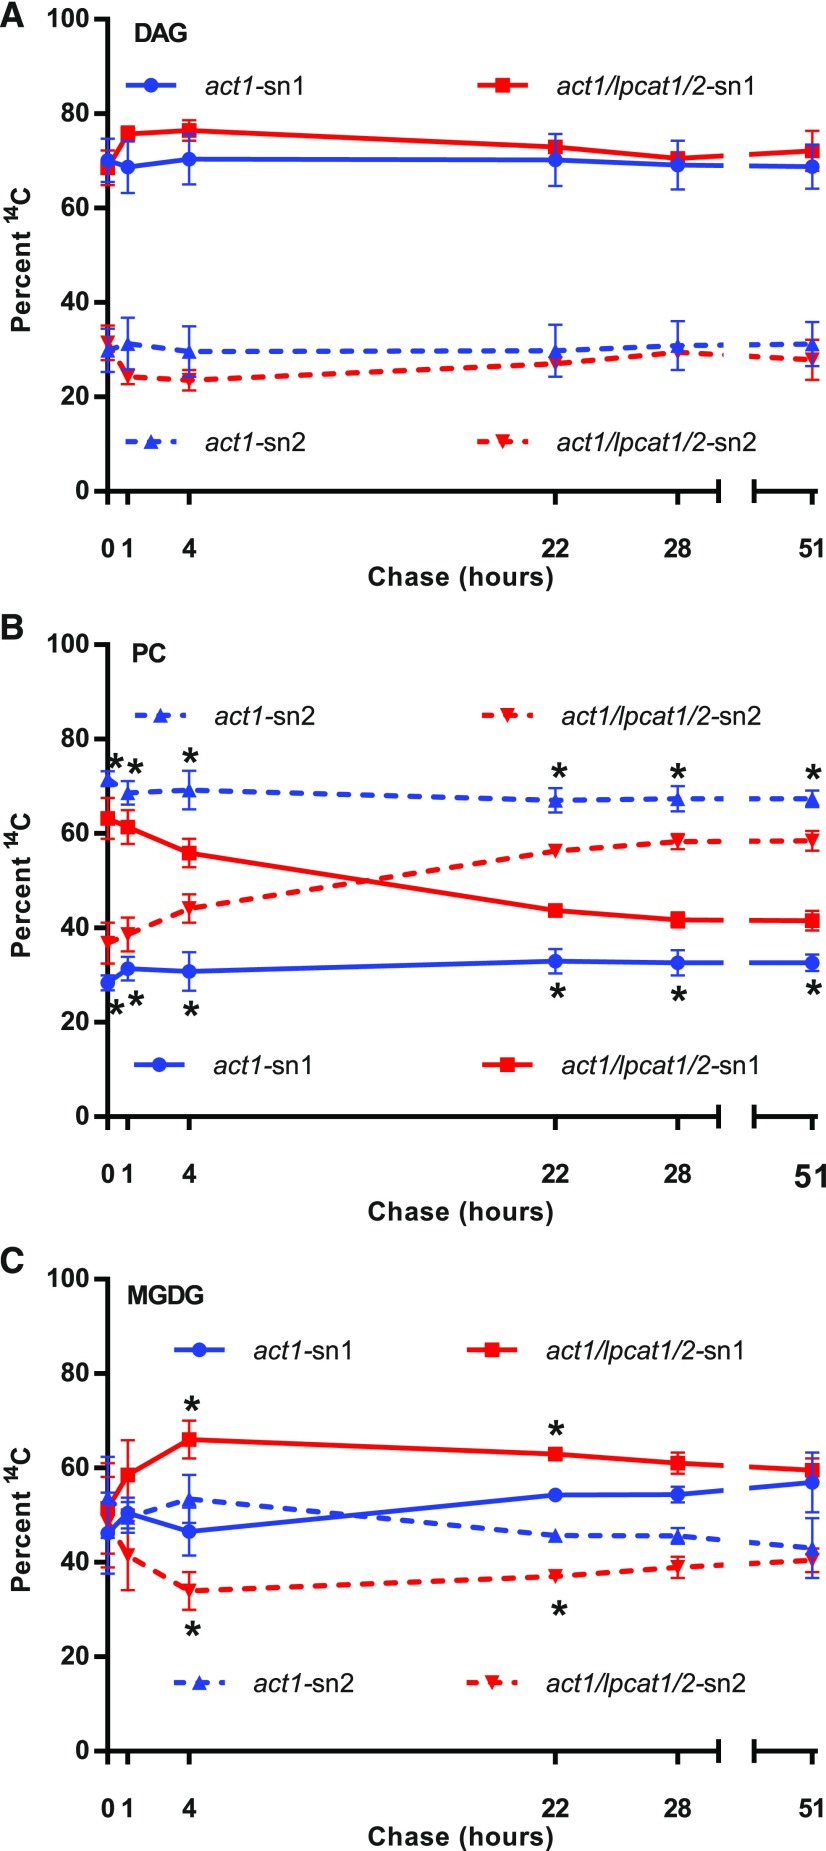
Figure 10.
Stereochemical Analysis of [14C]Acetate-Labeled Fatty Acids within DAG, PC, and MGDG over the Pulse-Chase Time Course.
The sn-1 position is solid lines; the sn-2 position is dashed lines. The act1 samples are blue lines; the act1 lpcat1 lpcat2 samples are red lines.
(A) DAG.
(B) PC.
(C) MGDG.
All data points are average and se from three sets of independently labeled plants from Figure 8. Significant differences (Student’s t test, p-value <0.05) in lipid labeling between act1 and act1 lpcat1 lpcat2 stereochemical positions at each time point are indicated by asterisks next to the act1 blue lines in (B), and next to the act1 lpcat1 lpcat2 red lines in (C).

