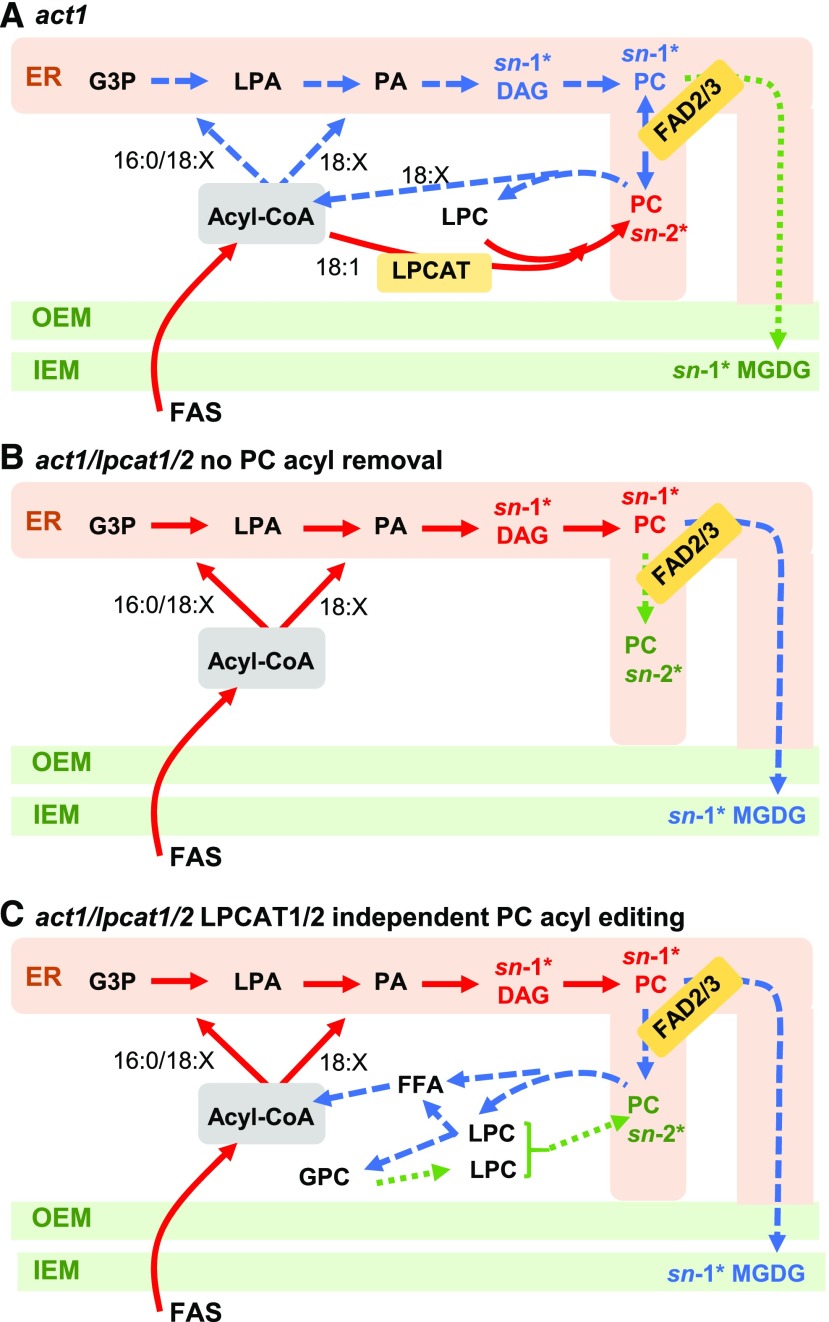
Figure 11.
Models of [14C]Acetate Pulse-Chase Labeling of MGDG Synthesis in act1 and act1 lpcat1 lpcat2 Leaves.
The models indicate the relative rate of labeled fatty acid flux through the eukaryotic pathway of MGDG synthesis within the pulse-chase experiment. Red solid lines represent initial reactions, blue large dashed lines represent the next set of reactions labeled over time, and the green small dashed lines represent the slowest set of reactions labeled over time within each model. Likewise, for the DAG, PC, and MGDG pools, the major labeled stereochemical position at various time points is indicated by the position noted with an asterisk and color coding the same as the lines. No specific time points are intended, and each model color coding is independent from the others, representing only relative labeling within each model.
(A) act1.
(B) act1 lpcat1 lpcat2 with no PC acyl chain removal from residual acyl-editing mechanisms.
(C) act1 lpcat1 lpcat2 with compensating acyl-editing reactions that lead to acyl chain removal from PC and incorporation into the acyl-CoA pool, and the switching of PC labeled stereochemistry from sn-1 to sn-2.

