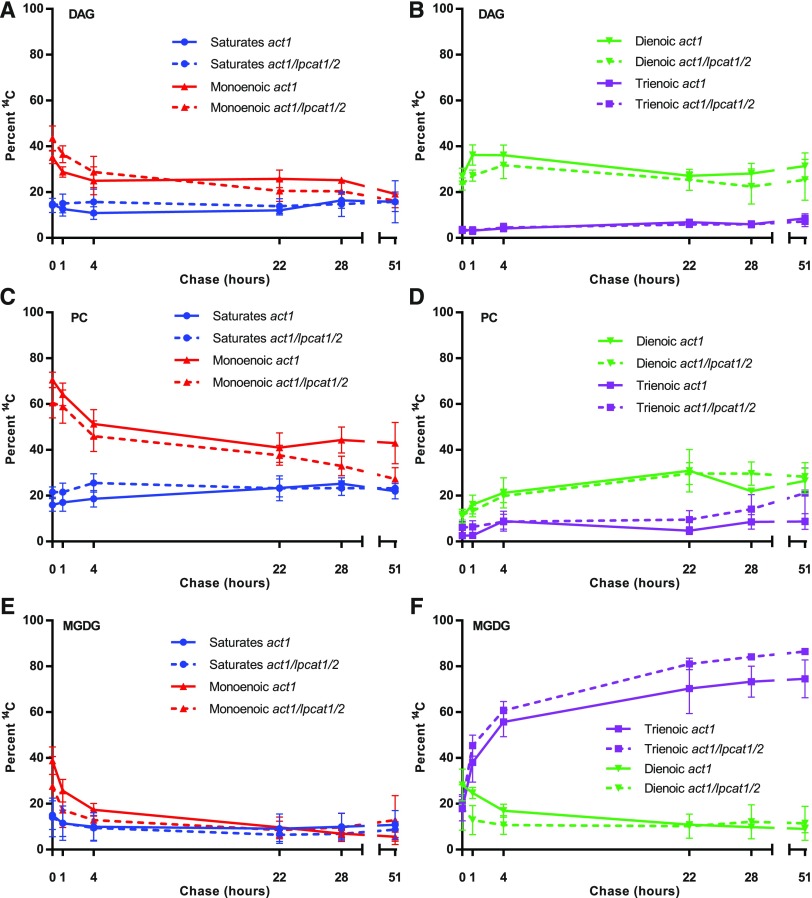
Figure 9.
Radiolabeled Fatty Acid Composition of DAG, PC, and MGDG over the [14C]Acetate Pulse-Chase Time Course.
The radiolabeled fatty acids in different lipids from Figure 8 are represented as total saturated fatty acids (e.g., 16:0, 18:0), monoenoic fatty acids (e.g., 18:1), dienoic (e.g., 18:2), and trienoic (e.g., 18:3). The proportion of each fatty acid within each lipid is compared between plant lines with act1 as solid lines, and act1 lpcat1 lpcat2 as dashed lines.
(A) and (B) DAG.
(C) and (D) PC.
(E) and (F) MGDG.
All data points are average and se from three sets of independently labeled plants from Figure 8. Significant differences (Student’s t test, p-value <0.05) in lipid labeling between lines at each time point are indicated by asterisks above the data points.

