. 2019 Oct 29;8:e51481. doi: 10.7554/eLife.51481

Figure 3. Contrasting evolutionary stability of collateral sensitivity for CAR>GEN and GEN>CAR switches.

Evolutionary dynamics of surviving populations expressed as relative biomass for (a) CARR-populations during selection with GEN, and (b) GENR-populations during selection with CAR. The dotted horizontal line indicates growth equal to untreated controls. Mean ±CI95, number of biological replicates differs due to extinction (n = 2–8). Changes in antibiotic resistance at the end of the second-step evolution experiment for (c) CARR-populations after selection with GEN and (d) GENR-populations after selection with CAR. Resistance was tested either against the drug towards which bacteria initially showed resistance after the first evolution experiment (indicated as OLD), or the drug used during the second experiment (indicated as NEW). The change is measured by cumulative differences in dose-response before and after the second evolution experiment (i.e., the original antibiotic resistant clone versus its evolved descendants). Mean ±CI95, n = 2–8 biological replicates (differences due to extinction). Asterisks indicate significant changes in resistance (one-sample t-test, µ = 0, FDR-adjusted probabilities). Change of maximum exponential growth rate in drug-free conditions for the evolved lineages, relative to wild type PA14 for (e) CARR>GEN lineages and, (f) GENR>CAR lineages. This measure is used to explore the presence of a general adaptation trade-off. The evolved lineages were grouped by whether experimental evolution was performed under constrained conditions (i.e., presence of drug A and B; dark gray circles) or not (i.e., only presence of drug B; light gray circles). The dashed line in each panel then indicates relative growth rate of the starting resistant population. Asterisks show significant increases or decreases in growth rate relative to the wild type PA14 (One-sample t-test, µ = 1, p<0.004), while numerals indicate significant increases or decreases relative to the starting population (dashed lines in each panel, One-sample t-test, µ = GENR or CARR, p<0.004). Number of populations per group and experiment vary due to extinction (min = 10, max = 16). The following supplementary figures, tables and source data is available for Figure 3: Figure 3—figure supplement 1, Figure 3—figure supplement 2, Supplementary file 1-Figure 3-supplementary tables 1-3, and Figure 3—source data 1; Figure 3—source data 2; Figure 3—source data 3.

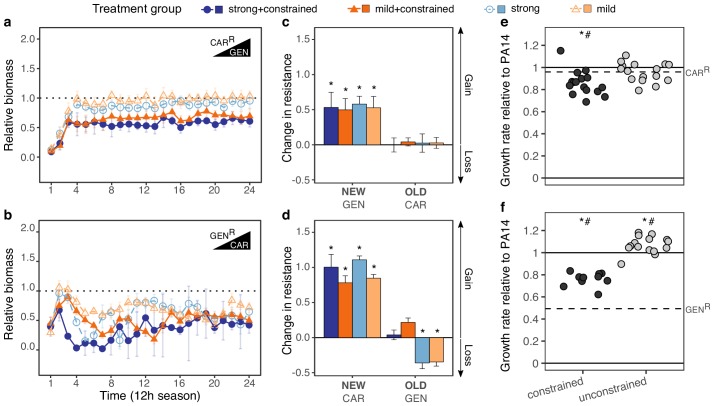
Figure 3—source data 1. Evolutionary dynamics summarized by the area under the curve (AUC) across experimental seasons relative to the reference treatment with no drugs.
Data is shown for all following experiments: CARR>GEN, GENR>CAR, PITR>STR and STRR>PIT, as reported in Figure 3a and b and Figure 3—figure supplement 1a and b.
Figure 3—source data 2. Dose-response curves data of surviving populations challenged with CAR, GEN, STR and PIT.
Data is shown in Figure 3c and d, and Figure 3—figure supplement 1c and d. Optical density values were recorded after 12 hr of incubation at 37 °C.
Figure 3—source data 3. Growth rate estimates of the surviving population challenged with CAR or GEN, as reported in Figure 3.
Growth rate was calculated as specified in the Materials and methods section.

Figure 3.

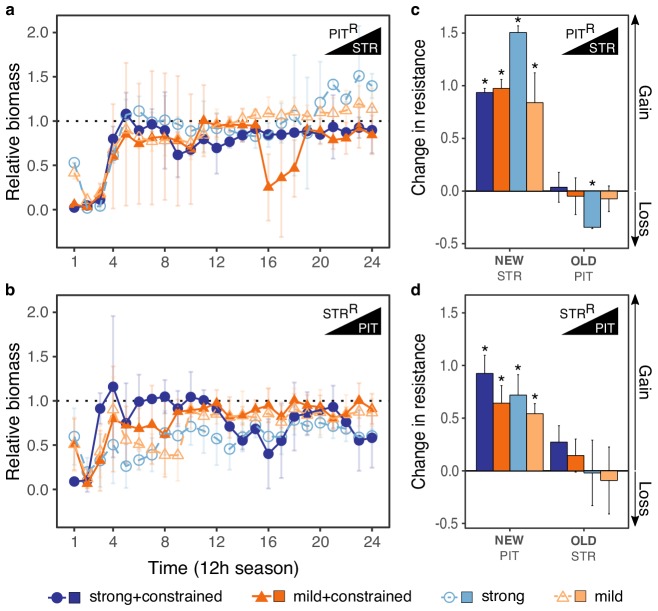
Figure 3—figure supplement 1. Evolutionary stability of collateral sensitivity for PITR>STR and STRR>PIT switches.

Figure 3—figure supplement 1.

Evolutionary dynamics of surviving populations expressed as relative biomass for (a) PITR-populations during selection with STR, and (b) STRR-populations during selection with PIT. The dotted horizontal line indicates growth equal to untreated controls. Mean ±CI95, number of biological replicates differs due to extinction (min = 2, max = 8). Changes in antibiotic resistance at the end of the second-step evolution experiment for (c) PITR-populations after selection with STR and (d) STRR-populations after selection with PIT. Resistance was tested either against the drug towards which bacteria initially showed resistance after the first evolution experiment (indicated as OLD), or the drug used during the second experiment (indicated as NEW). The change is measured by cumulative differences in dose-response before and after the second evolution experiment (i.e., the original antibiotic resistant clone versus its evolved descendants). Mean ±CI95, n = 2–8 biological replicates (differences due to extinction). Asterisks indicate significant changes in resistance (one-sample t-test, µ = 0, FDR-adjusted probabilities). Superscript R denotes resistance against the particular drug. The data for this figure is provided in Figure 3—source data 1 and Figure 3—source data 2.
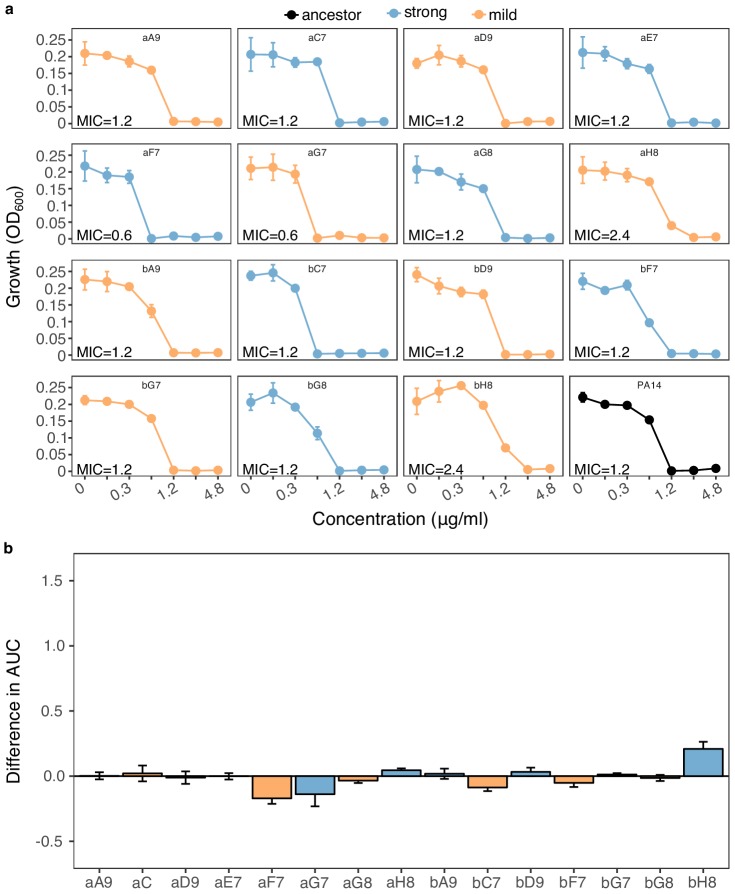
Figure 3—figure supplement 2. Re-sensitization to gentamicin (GEN) upon adaptation to carbenicillin (CAR).

Figure 3—figure supplement 2.

We calculated (a) dose-response relationships against GEN of 15 populations adapted to strong (n = 7, light blue) and mild (n = 8, light orange) drug increases compared to the PA14 ancestor (black, bottom-right panel). Mean ±CI95, n = 3 technical replicates. In most cases, the evolved population had the same MIC as PA14. Two populations (aF7 and aG7) showed lower MICs than PA14, while two (aH8 and bH8) showed slightly higher ones. The labels within each graph correspond to the code used during experimental evolution. Data from Source Data 4 (b) Difference in the area under the curve (AUC) between each evaluated population and the PA14 ancestor. Scaling of the y-axis is equivalent to Figure 3d. None of the populations was significantly different from the ancestor (Wilcoxon’s test, n = 3, adjusted P values min > 0.4, and max <0.9). The data for this figure are provided in Figure 3—figure supplement 2—source data 1; Figure 3—figure supplement 2—source data 2.
Figure 3—figure supplement 2—source data 1. Dose-response curves data of surviving populations adapted to unconstrained environments (strong and mild), as well as the PA14 wild type against GEN.
The data is shown in Figure 3—figure supplement 2. Each population-drug concentration was evaluated in triplicate.
Figure 3—figure supplement 2—source data 2. Change in resistance of populations adapted to unconstrained environments (strong and mild) relative to the PA14 wild type against GEN.
The data is shown in Figure 3—figure supplement 2. The resistance change was inferred by calculating the difference between the evolved populations and the PA14 wild type in the AUC across drug concentrations.