
Figure 6. Predictors of evolutionary stability of collateral sensitivity in a larger set of drug switches.
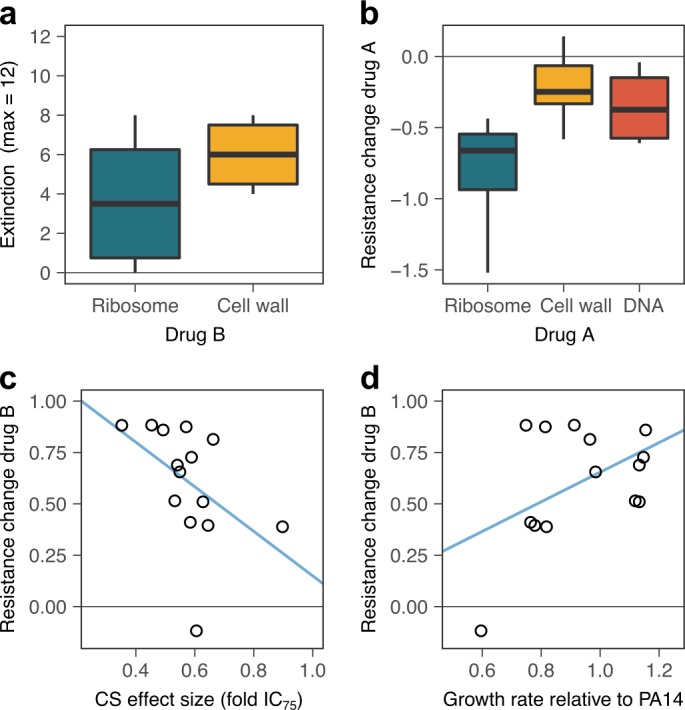
(a) Extinction was more likely when treatment was switched to β-lactam antibiotics that target the cell wall, as compared to aminoglycoside antibiotics that target ribosomes (box plot, n = 6 drug switches for ribosome, n = 8 treatments for the cell wall). Combined extinction events from both treatment groups are reported. (b) Surviving, evolved lineages showed stronger re-sensitization when the first antibiotic targeted the ribosome (box plot, n = 4 drug switches starting with ribosome inhibition, n = 4 drug switches starting with cell-wall inhibition, and n = 6 drug switches starting with DNA gyrase inhibition). (c) Evolution of new resistance was significantly positively associated with the average effect size of collateral sensitivity, as measured by fold-change of IC75. Values of sensitivity increase to the left. (d) Average initial growth rate were significantly associated with the resistance gains, with low resistance gains associated with large general adaptation trade-offs. CS, collateral sensitivity. Blue lines in c and d provide an illustration of the linear association between the respective variables. The following supplementary tables and source data are available for (Figure 6: Supplementary file 1-Figure 6-supplementary tables 1-2, and Figure 6—source data 1; Figure 6—source data 2).