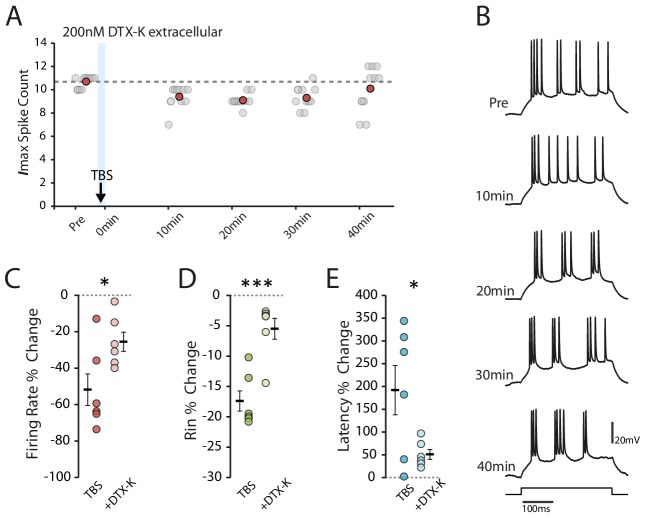
Figure 7. Dendrotoxin-K reduces the effect of TBS on excitability.
(A-B) Example cell recorded after the application of DTX-K. Scatter plot shows the response to each of the maximum current injections during the testing protocol (grey circles). The red circles mark the mean response at each timepoint. Dark grey borders mark the current steps depicted in (B). (C-E) Comparisons of changes in firing rate (C), input resistance (D) and latency (E) between TBS alone (n = 6) and with DTX-K (n = 6) for cells where TBS evoked at least 250 spikes. Error bars show mean ± SEM.

