. 2019 Nov 11;8:e48767. doi: 10.7554/eLife.48767

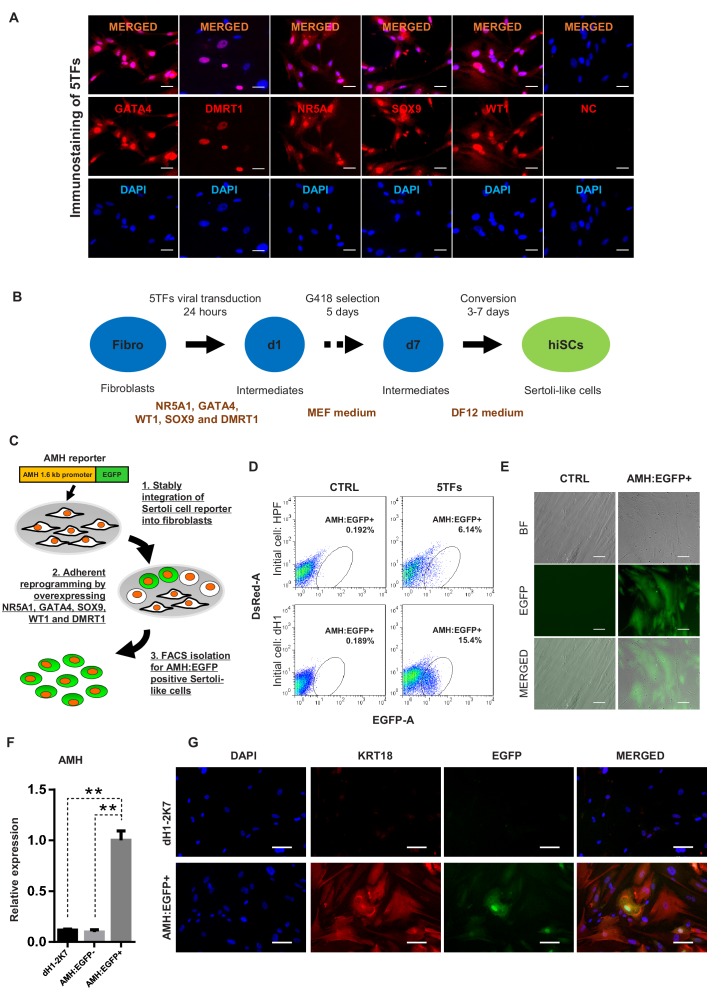
Figure 1. Induction of Sertoli-like cells (hiSCs) from human fibroblasts.

(A) Immunostaining of NR5A1, GATA4, WT1, SOX9 and DMRT1 (red signal) in fibroblasts (HPF) 3 days post infection. DAPI (blue signal) was used to indicate nucleus. Scale bar = 25 μm. NC represents HPF stained with only secondary antibody. (B) Experimental design for the reprogramming of human Sertoli-like cells (hiSCs). Human fibroblasts were infected by lentivirus carrying human transcription factors: NR5A1, GATA4, WT1, SOX9 and DMRT1 (5TFs). The cells were cultured in MEF medium for 1 day after infection and followed by G418 selection for 5 days, then changed to DMEM/F12 medium. hiSCs were characterized 10–14 days post viral transduction. (C) Schematic protocol for the enrichment of Sertoli-like cells (hiSCs). An AMH:EGFP reporter was integrated to the fibroblasts for hiSCs quantification and isolation. (D) FACS analysis of AMH:EGFP+ cell at day 10 after 5TFs infection. The percentage of EGFP+ cell was used to determine the reprogramming efficiency. Two types of human fibroblasts (HPF and dH1) were tested. Cells infected by p2k7 empty virus were used as negative control (CTRL). (D) Morphology of re-plated AMH:EGFP+ hiSCs after FACS. Scale bar = 20 μm. (F) The mRNA level of AMH was enriched in AMH:EGFP+ hiSCs, as compared to dH1 infected by p2k7 empty virus (dH1-2K7) and AMH:EGFP-. n = 3, technical replicates of ~5 × 104 cells were collected by FACS. All data are presented as means ± SD. *p<0.05, **p<0.01, Student’s t-test.>3 independent experiments were carried out. (G) Immunofluorescent staining of KRT18 in AMH:EGFP+ hiSCs and dH1 infected by p2k7 empty virus (dH1-2K7) after FACS. Scale bar = 100 μm.

Figure 1.

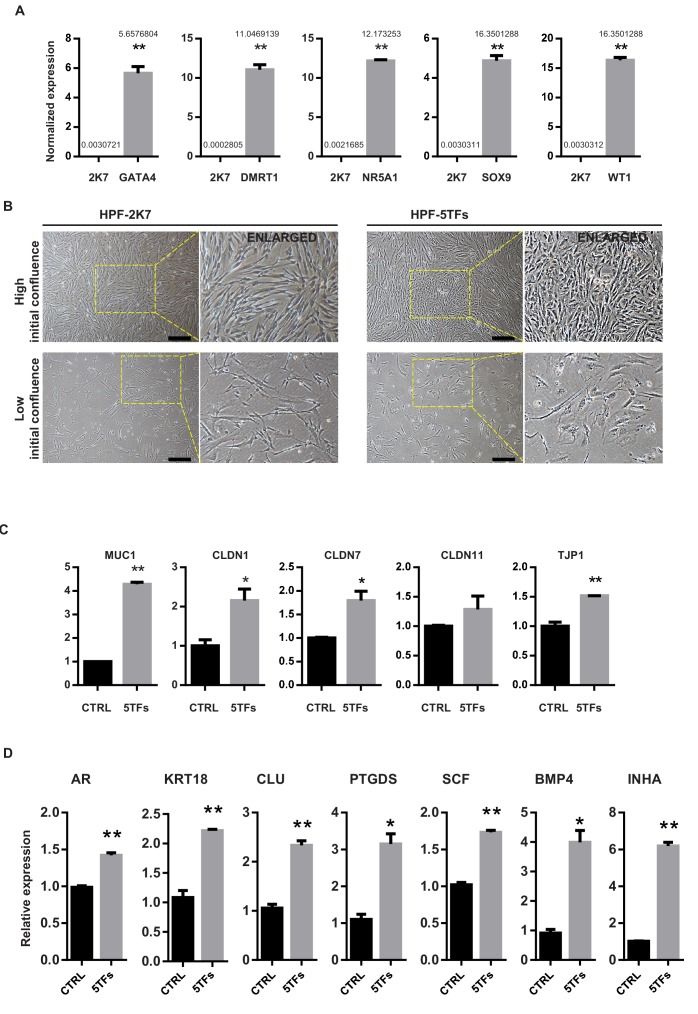
Figure 1—figure supplement 1. Reprogramming effect of 5F on human primary fibroblasts.

Figure 1—figure supplement 1.

(A) Quantitative PCR result showing the mRNA level of GATA4, DMRT1, NR5A1, SOX9 and WT1 was overexpressed in 293FT cells after virus infection. ACTIN was used as the housekeeping gene for normalization. n = 2 (technical replicates of ~4 × 105 cells were collected). All data are presented as means ± SD, *p<0.05, **p<0.01, Student’s t-test.>2 independent experiments were carried out. (B) hiSCs showed epithelial morphology change after 5 TFs overexpression. Magnified images were shown on the right side. Two types of cell density were tested. Scale bars = 400 μm. (C) Quantitative PCR result showing that the mRNA level of epithelial markers increased after overexpression of NR5A1, GATA4, SOX9, WT1 and DMRT1 (5TFs). Fold expression was normalized to the group infected by empty virus p2k7 (CTRL). ACTIN was used as the housekeeping gene for normalization. All data are presented as means ± SD. *p<0.05, **p<0.01, Student’s t-test. n = 2 (technical replicates of ~4 × 105 cells were tested). (D) Quantitative PCR result showing the mRNA levels of Sertoli cell markers. Relative expression of 5TFs groups was normalized to the level of HPF cells infected by empty virus 2K7 (CTRL). All data are presented as means ± SD, asterisks indicate statistical significance, (*p<0.05, **p<0.01, Student’s t-test).
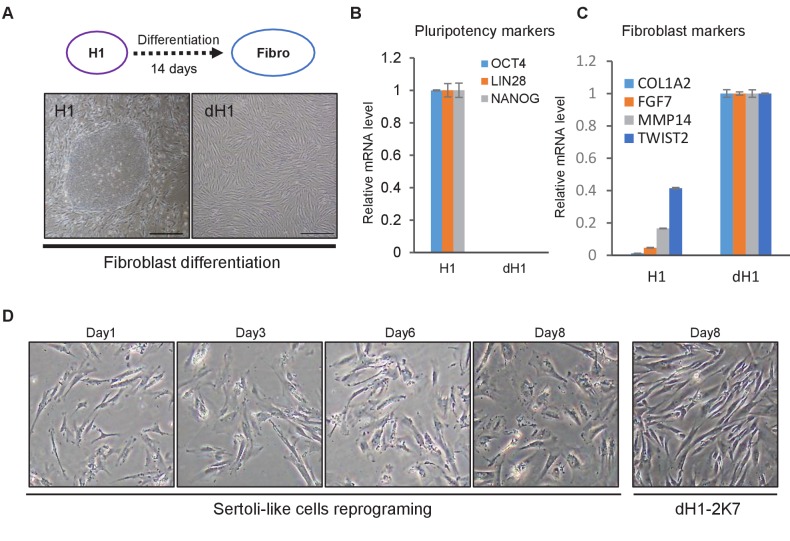
Figure 1—figure supplement 2. Reprogramming effect of 5F on differentiated hESC H1.

Figure 1—figure supplement 2.

(A) Morphology of human embryonic stem cells (H1) in feeder cell system (left) and the fibroblast-like cells (dH1, right) derived from H1 by spontaneous differentiation in KSR + K-DMEM medium for 14 days. Scale bar = 400 μm. (B) Expression of hESC pluripotency markers in H1 and dH1 at day 14 after spontaneous differentiation, measured by qPCR. Expression level in dH1 was normalized to the level of undifferentiated H1. All data are presented as means ± SD, asterisks indicate statistical significance, *p<0.05; **p<0.01, Student’s t-test, versus control. (C) Expression of fibroblast markers in H1 and dH1 at day 14 after spontaneous differentiation, measured by qPCR. Expression level in dH1 was normalized to the level of undifferentiated H1.All data are presented as means ± SD, asterisks indicate statistical significance, *p<0.05; **p<0.01, Student’s t-test, versus control. (D) Cell morphology of reprogrammed dH1 at day1 to day8 after induction. dH1 transduced with p2k7 lenivirus was used as a control.
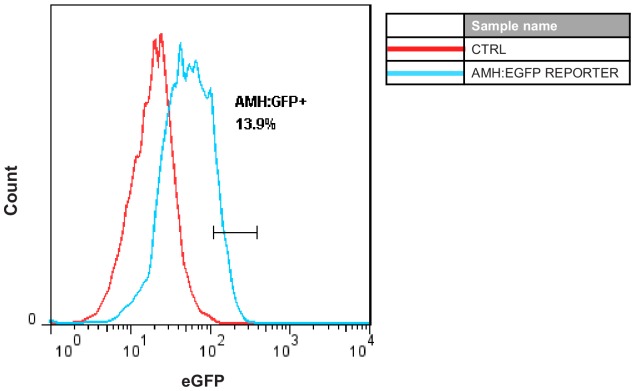
Figure 1—figure supplement 3. FACS analysis of AMH:EGFP+ population in adult Sertoli cells 10 days after AMH:EGFP reporter virus infection.

Figure 1—figure supplement 3.

Cells infected by p2k7 empty virus were used as a negative control (CTRL).