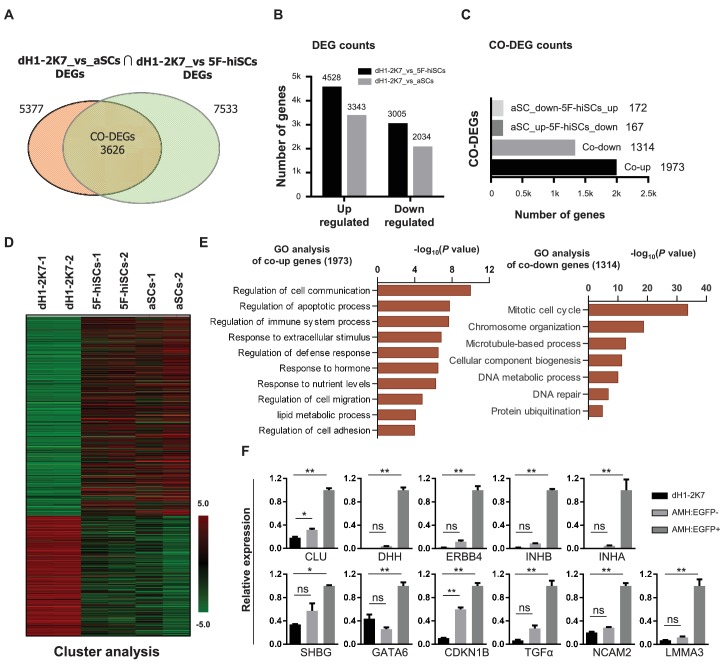
Figure 2. Whole genome transcriptional profiling of AMH:EGFP+ hiSCs.
(A) Venn diagram to display differentially expressed genes (DEGs, FPKM value, fold change >2) between dH1-2K7_vs_aSCs (n = 2) and dH1-2K7_vs_5F-hiSCs (n = 2). Intersection part represents the number of co-differentially expressed genes (CO-DEGs). (B) Summary of DEGs in (A). X axis represents upregulated DEGs and downregulated DEGs. Y axis represents DEGs numbers. Comparisons of different sample sets were represented by different colors. Black bar represents dH1-2K7_vs_5F-hiSCs. Gray bar represents dH1-2K7_vs_aSCs. (C) Summary of CO-DEGs in (A). X axis represents CO-DEGs number. Black bar represents co-upregulated DEGs. Gray bar represents co-downregulated DEGs. Dark gray bar and light gray bar represent CO-DEGs in opposite trend, respectively. (D) Heat map of gene expression of dH1-2K7, 5F-hiSCs and aSCs (n = 2 in each group). Red indicates upregulated expression, green indicates downregulated expression. (E) Functional enrichment analysis, biological processes of 1973 and 1314 differentially expressed genes were showed. (F) The mRNA level of Sertoli cell markers in dH1-2K7, AMH:EGFP- cells and AMH:EGFP+ cells, as measured by qPCR. Relative expression was normalized to dH1-2K7. GAPDH was used as the housekeeping gene. All data are presented as means ± SD, n = 2, *p<0.05, **p<0.01, Dunnett’s test. three independent experiments were carried out.

