. 2019 Nov 11;8:e48767. doi: 10.7554/eLife.48767

Figure 3. NR5A1 and GATA4 are sufficient to derive hiSCs.

(A) Representative FACS results of different combinations of NR5A1, GATA4, WT1, SOX9 and DMRT1 for the induction of AMH:EGFP+ cells. dH1 fibroblasts were transduced with the indicated factors and reprogrammed for 10 days. The combinations were divided into three groups: -NR5A1, combinations without NR5A1; +NR5A1, combinations with NR5A1 but without GATA4; +NR5A1 and GATA4, combinations with both NR5A1 and GATA4. (B) Quantitative data of EGFP+ cells in (A). n = 2, biological replicates, error bar indicates SD, three independent combination experiments were conducted. ~104 cells were analyzed in each experiment. (C) Immunofluorescent staining of KRT18 in 2F-hiSCs and dH1-2K7 after FACS. Scale bar = 100 μm. (D) Heat map of RNA-seq data illustrating differentially co-expressed genes. Red indicates upregulated expression, whereas green indicates downregulated expression. The genes were divided into three groups: Genes upregulated in 2F-hiSCs (dH1), 5F-hiSCs (dH1) and aSCs; genes upregulated in 5F-hiSCs (dH1) and aSCs but downregulated in 2F-hiSCs (dH1); genes downregulated in 2F-hiSCs (dH1), 5F-hiSCs (dH1) and aSCs; all compared to dH1-2K7. The gene number of each group was listed next to the map. Functional enrichment terms of each group and the representative genes were shown on the right side.

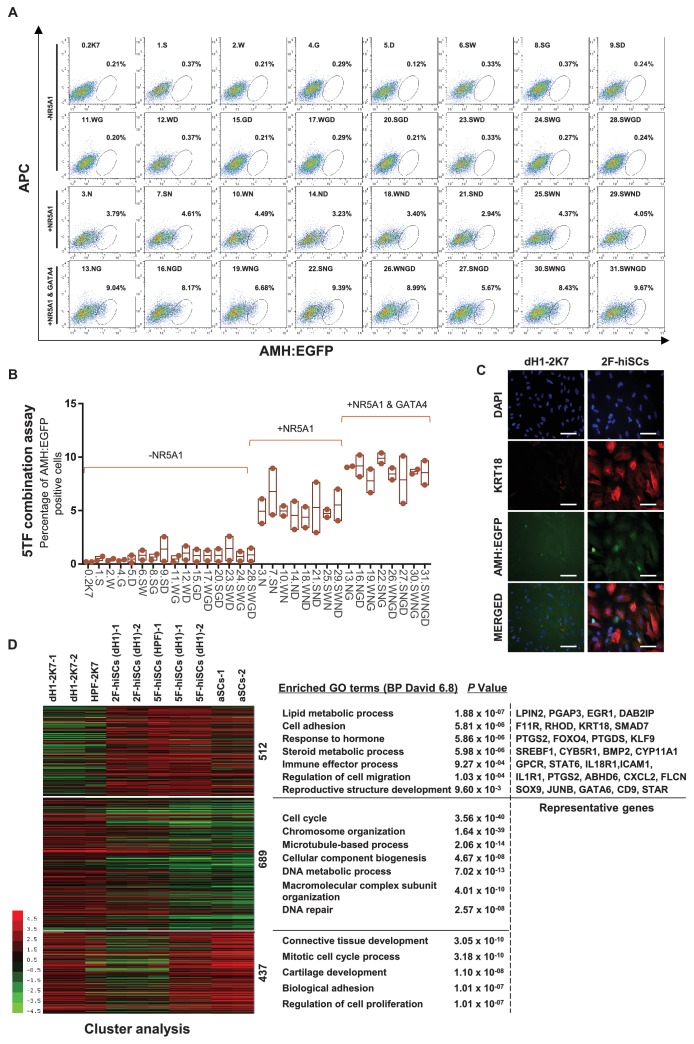
Figure 3.

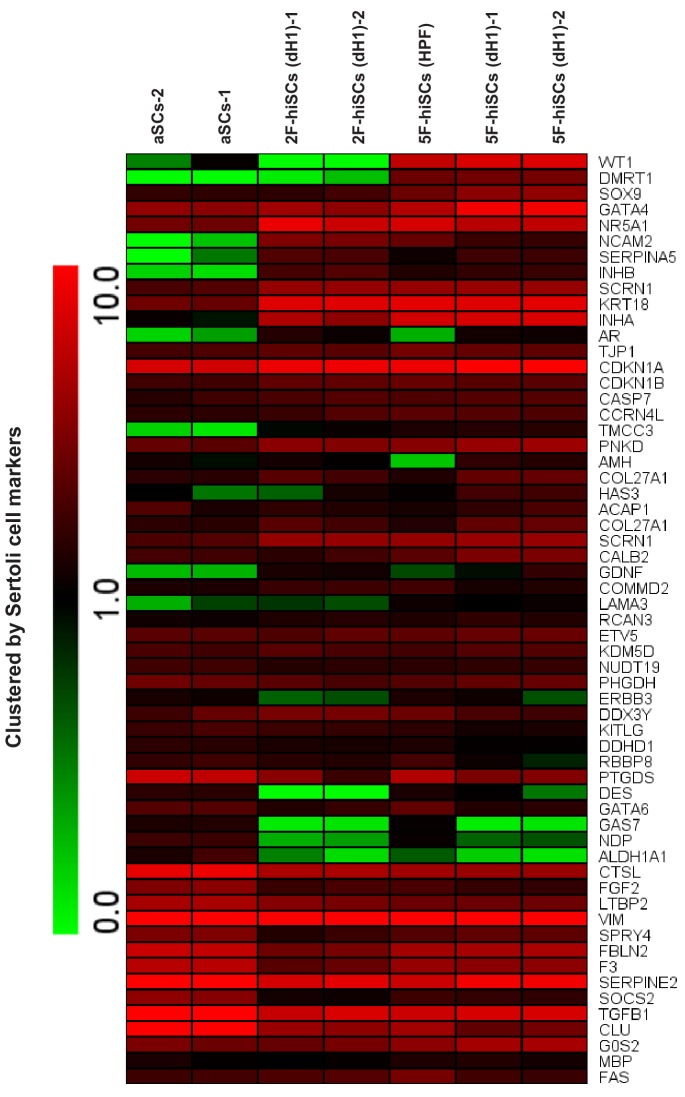
Figure 3—figure supplement 1. Heat map clustered by the expression of Sertoli cell markers in 2F-hiSCs, 5F-hiSCs and aSCs cells.

Figure 3—figure supplement 1.

Red indicates higher expression and green indicates lower expression.
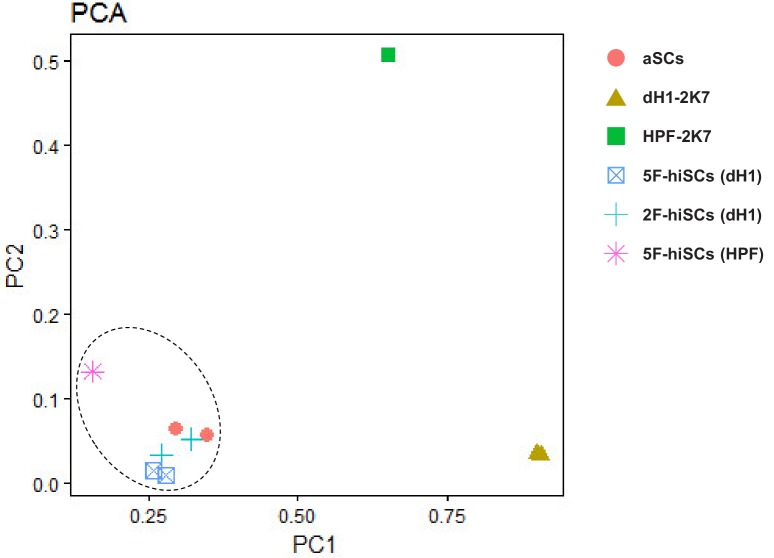
Figure 3—figure supplement 2. PCA plot of differentially co-expressed genes in 2F-hiSCs (dH1), 5F-hiSCs (dH1) , 5F-hiSCs (HPF) and aSCs, compared to dH1-2K7.

Figure 3—figure supplement 2.

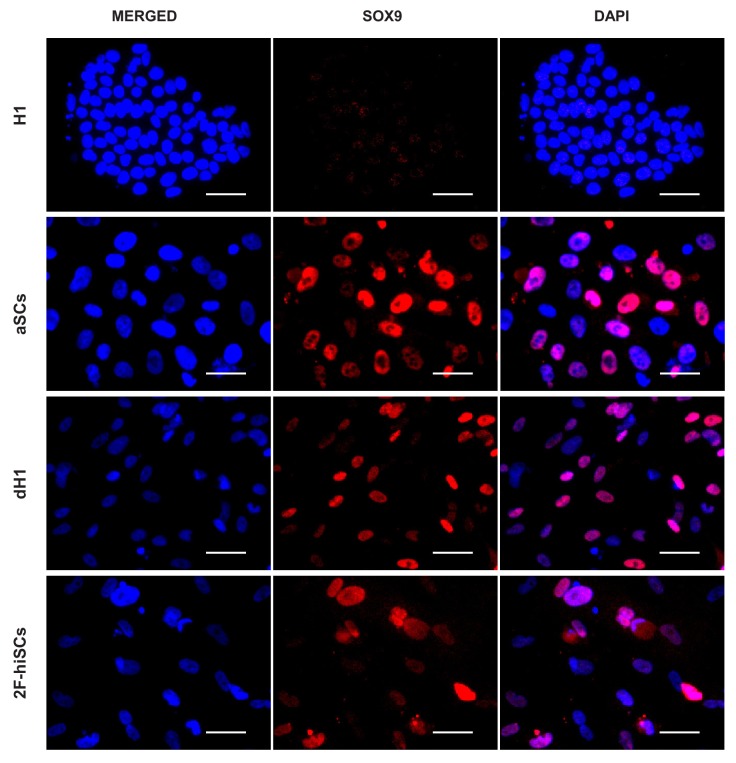
Figure 3—figure supplement 3. Immunofluorescent staining of SOX9 (red) in dH1, 2F-hiSCs, hESCs (H1) and adult Sertoli cells (aSCs).

Figure 3—figure supplement 3.

DAPI (blue) was used to indicate the nucleus. Scale bar = 50 μm.
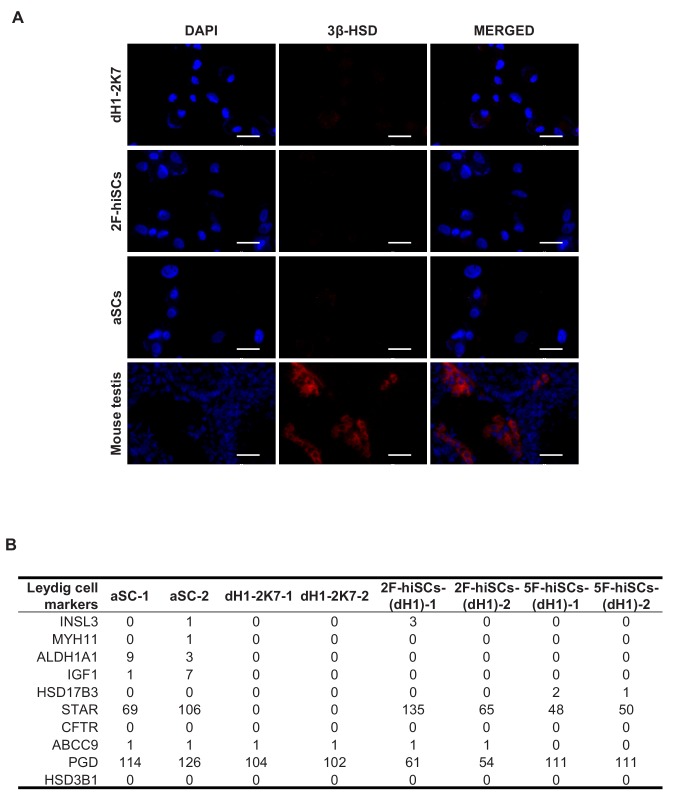
Figure 3—figure supplement 4. hiSCs and aSCs do not express Leydig cell specific markers.

Figure 3—figure supplement 4.

(A) Cytospin immunostaining of Leydig cell specific marker 3β-HSD in fibroblasts (dH1-2K7), 2F-hiSCs and adult Sertoli cells (aSCs). 18 dpp mouse testis freezing section was used as positive control cells. Scale bar = 50 μm. (B) FPKM values of some reported Leydig cell markers in dH1-2K7, 2F-hiSCs (dH1), 5F-hiSCs (dH1) and aSCs, according to RNA-seq data presented in Figure 2.
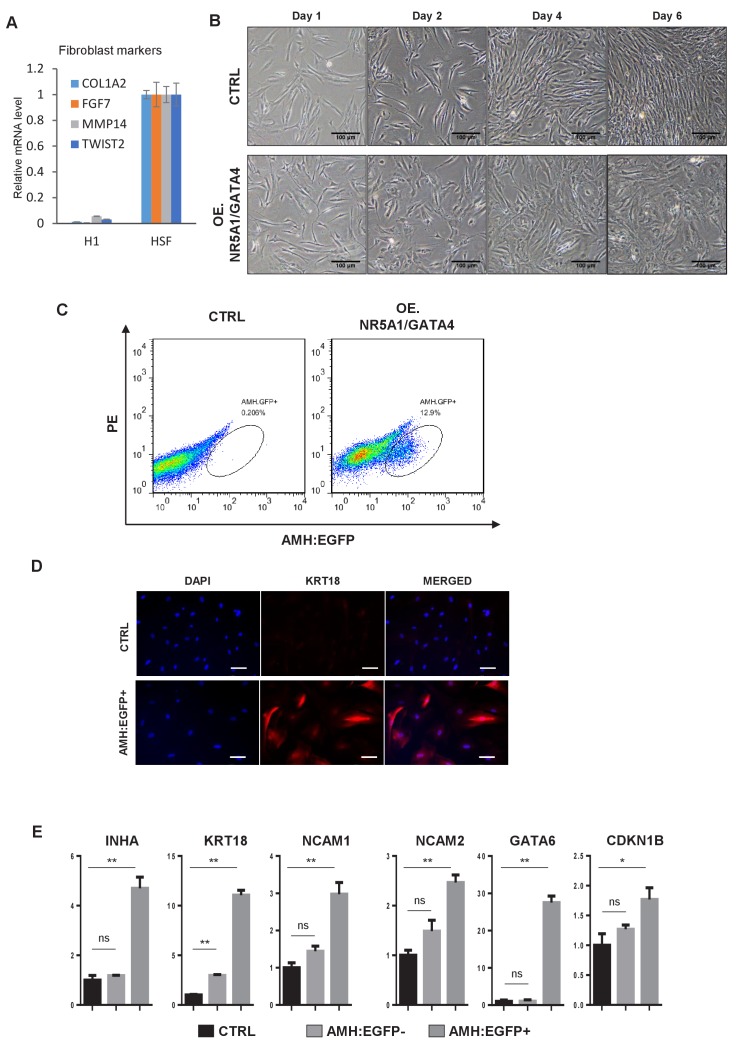
Figure 3—figure supplement 5. Induction of hiSCs from primary human skin fibroblasts.

Figure 3—figure supplement 5.

(A) Expression of fibroblast markers in primary human skin fibroblasts (HSF) as measured by qPCR. Expression level in dH1 was normalized to the level of undifferentiated H1. All data are presented as means ± SD. (B) Cell morphology of reprogrammed HSF at day1, day2, day4 and day6 after infection by NR5A1 and GATA4. HSF transduced with p2k7 lenivirus was used as a control. Scale bar = 200 μm. (C) FACS analysis of AMH:EGFP+ cells at day 10 after NR5A1 and GATA4 virus infection, the percentage of EGFP+ cell was used to determine the induction efficiency. HSF transduced with p2k7 lentivirus was used as a control. (D) Immunofluorescent staining of KRT18 in AMH:EGFP+ hiSCs and HSF infected by p2k7 empty virus (CTRL) after FACS. Scale bar = 100 μm. (E) The mRNA level of Sertoli cell markers in AMH:EGFP- cells and AMH:EGFP+ cells as measured by qPCR. Fold expression was normalized to the levels of HSF infected by empty virus p2k7 (CTRL). ACTIN was used as the housekeeping gene for normalization. All data are presented as means ± SD, n = 2, *p<0.05, **p<0.01, dunnett-t test, three independent experiments were carried out.