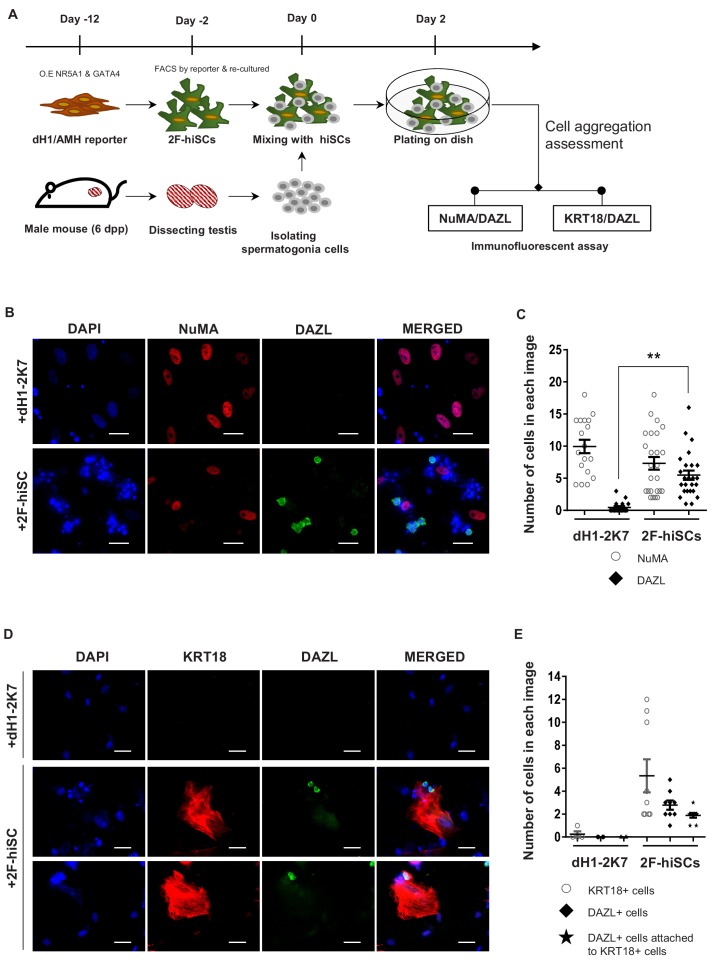
Figure 5. 2F-hiSCs sustain the viability of mouse spermatogonia cells.
(A) Timeline and steps of co-culturing hiSCs with mouse germ cells. (B) Immunofluorescent staining of germ cell marker, DAZL (green), and human specific marker, NuMA (red), in co-cultured mouse spermatogonia cells with 2F-hiSCs or dH1-2K7 48 hr after plating. DAPI (blue) was used to indicate the nucleus. Scale bar = 50 μm. (C) Summary of cell numbers on the co-cultured plate in (B). Each data point indicates the number of cells counted in one separate image observed under 20 × fold microscope, area = 330 × 330 (μm). Error bars are the standard deviations of all the counted data points. dH1-2K7 (n = 18, technical replicates from two separated experiments), 2F-hiSCs (n = 25, technical replicates from two separated experiments). *p<0.05, **p<0.01, Student’s t-test. (D) Immunofluorescent staining of DAZL (green) and KRT18 (red) in co-cultured mouse spermatogonia cells and 2F-hiSCs 48 hr after plating. DAPI (blue) was used to indicate the nucleus. Scale bar = 50 μm. (E) Summary of cell numbers on the co-cultured plate in (D). Each data point indicates the number of cell counted in one separate image observed under 20 × fold microscope, area = 282 × 330 (μm). Error bars are the standard deviations of all the counted data points. dH1-2K7 (n = 4, technical replicates from two separated experiments), 2F-hiSCs (n = 9, technical replicates from two separated experiments). *p<0.05, **p<0.01, Student’s t-test.


