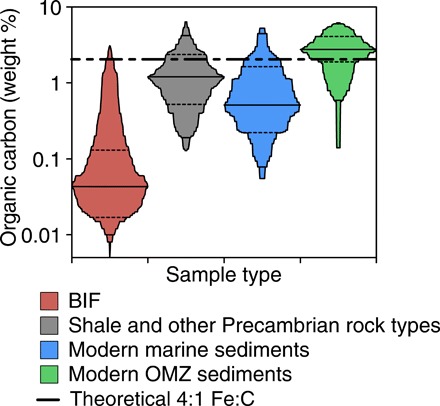
Fig. 1. The organic matter concentrations in BIFs, other Precambrian sedimentary rocks, typical modern marine sediments, and oxygen minimum zone (OMZ) sediments.

The solid lines represent the group means, while the dotted lines delineate one SD above and below the mean. The black dashed line that spans the figure represents the theoretical organic carbon concentration that would be expected in BIFs deposited by photoferrotrophs (2.04 wt % C), assuming quantitative co-sedimentation of biomass with ferric Fe. References for this figure can be found in table S5.
