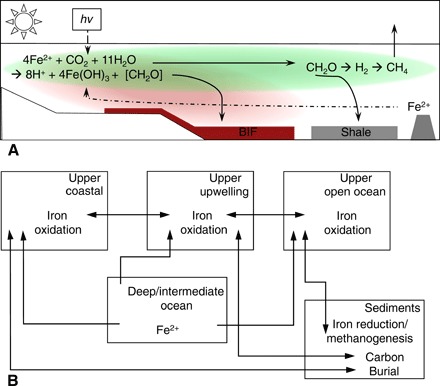
Fig. 4. Model of an Archean coastal upwelling zone.

A schematic (A) depicting the cycling of iron and carbon in the model and the boxes (B) that were used to create the model structure, accompanied by arrows demonstrating the fluxes of various biochemical parameters between the boxes.
