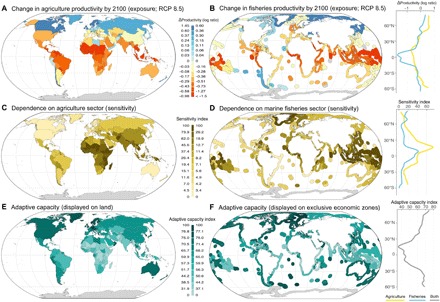
Fig. 2. Dimensions of agriculture and marine fisheries vulnerability to climate change.

(A and B) Average relative changes in agriculture productivity (maize, rice, soy, and wheat) and in maximum catch potential within exclusive economic zones projected by 2100 (RCP8.5) were used to estimate exposure of agriculture and fisheries, respectively. (C and D) Sensitivity on each sector is a composite metric of dependence for food, jobs, and revenue. (E and F) Adaptive capacity is based on future gross domestic product (GDP) per capita and is not sector specific. Socioeconomic indicators (C to F) are normalized between 0 (lowest possible value) and 100 (largest possible value). The right panels are latitudinal trends. Class intervals are quantiles.
