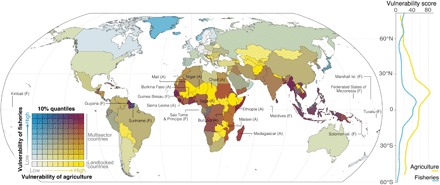
Fig. 3. Vulnerability of agriculture and marine fisheries as a function of exposure, sensitivity, and adaptive capacity to the impacts of climate change.

The bivariate map shows linked vulnerabilities of agriculture and fisheries for each country under RCP8.5. The 10 most vulnerable countries are indicated for agriculture (A) and marine fisheries (F). Right panel indicates latitudinal trends.
