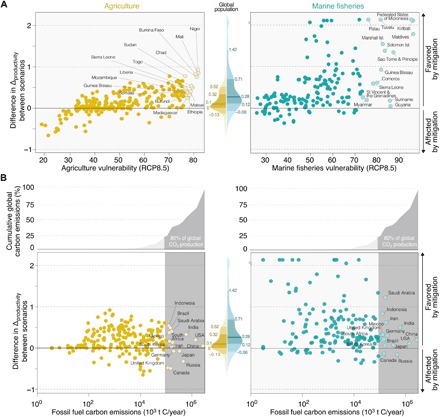
Fig. 5. Climate mitigation benefits for agriculture and marine fisheries productivity at the country-level.

(A) Countries’ net change in future agriculture and fisheries productivity potential induced by climate mitigation plotted against their corresponding vulnerability under RCP8.5. Net change represents the projected differences in changes in productivity potential from RCP8.5 (business as usual) to RCP2.6 (highly successful reduction of greenhouse gas emissions); negative and positive values thus indicate net loss (i.e., lower gains, higher losses, or gains to losses) and net gain (i.e., higher gains, lower losses, or losses to gains) from climate mitigation, respectively. The 15 most vulnerable countries are indicated. (B) Countries’ net change in future agriculture and fisheries productivity potential plotted against annual CO2 production with the top 15 CO2 producers indicated. Density plots show the distribution of the world’s population, and values report net change in sectors’ productivity at the 10th, 25th, 50th, and 90th percentiles of the distribution. See fig. S7 for global estimates on mitigation benefits and table S2 for details on the most vulnerable countries and top CO2 producers.
