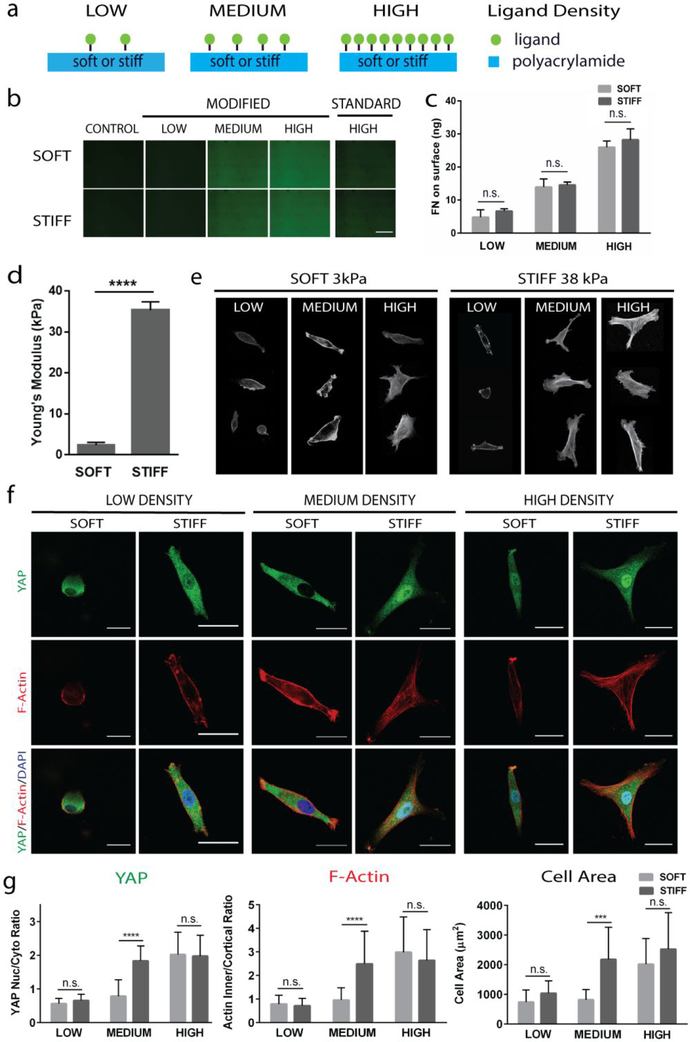
Figure 1: Stiffness-induced YAP translocation occurs only at intermediate ligand densities, not at low or high densities.
(a) Schematic illustrating experimental set up, (b) images of fluorescently-labeled fibronectin surfaces across ligand densities for our modified protocol and the standard protocol with high ligand density for comparison (Scale bar, 500 μm), (c) quantification of fibronectin incorporated on hydrogel surfaces with ELISA assay, (d) quantification of stiffness on polyacrylamide gel substrates, (e) cell morphology across a range of ligand densities at each stiffness, as shown by F-actin staining, (f) YAP localization (green) and F-Actin arrangement (red) on soft and stiff gels coated with low and high densities of fibronectin (Scale bars, 30 μm), and (g) quantification of YAP and F-Actin localization and cell areas. ****p<0.0001.

