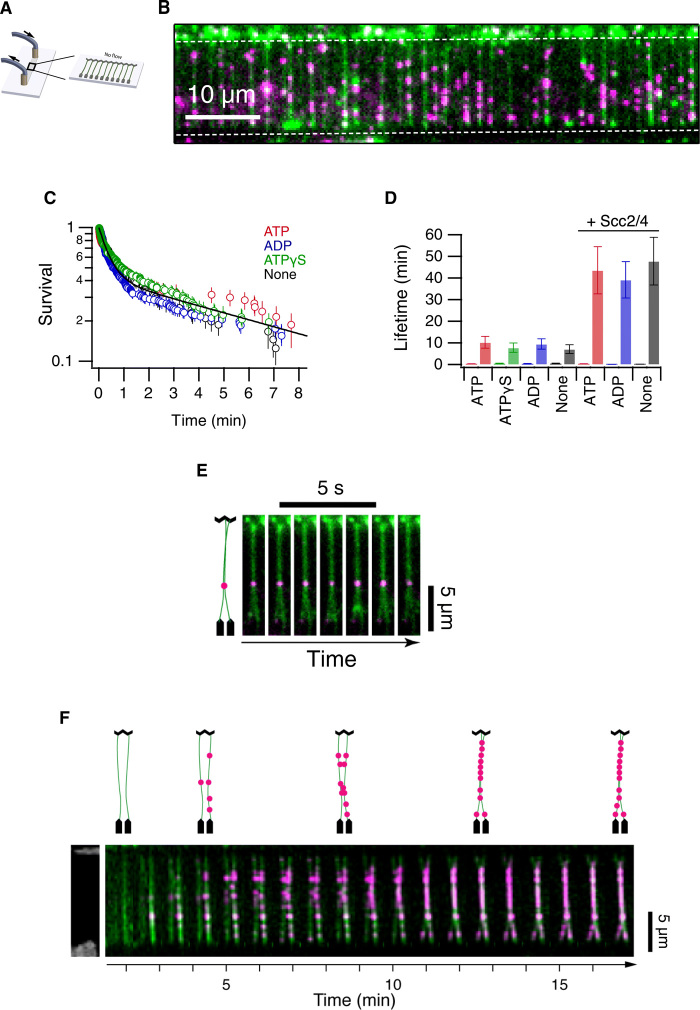
Fig. 2. Analysis of yeast cohesin on DNA curtains.
(A) Schematic representation of double-tethered DNA curtains used in the study. (B) Image of cohesin tagged with quantum dots (magenta) bound to λ-DNA stained with YOYO-1 (green). Scale bar, 10 μm. (C) Survival probability plots of cohesin in the presence of ATP, ADP, ATPγS, or no nucleotide. (D) Lifetimes of cohesin (fast phase and slow phase) in the presence or absence of Scc2-Scc4 and different ATP analogs. Error bars are 68% confidence intervals from bootstrapping. (E) Image of a pair of double-tethered DNA curtains bound by cohesin. DNA molecules are in green, and cohesin is in magenta. Diagrammatic representation is shown (left). (F) Time-lapse images of a pair of double-tethered DNA curtains bound by cohesin as they are tethered. DNA molecules are in green, and cohesin is in magenta. Diagrammatic representation is shown (top). Pairing events were observed frequently in the DNA curtains. An average of 5 to 10 events per DNA curtain was detected.

