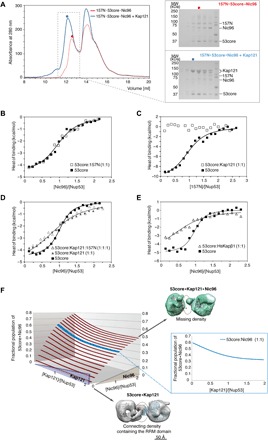
Fig. 3. Kap121 allosterically destabilizes ternary 157N·53core·Nic96 complex.

(A) SEC elution profiles of ternary 157N·53core·Nic96 complex alone (red trace) and preincubated with Kap121 (blue trace). Colored dots denote elution peak maxima, and dashed line rectangle represents the range of elution fractions visualized by SDS-PAGE on the right. (B to E) ITC profiles for interactions between (B) 53core and Nic96 in the absence or presence of 157N, (C) 53core and 157N in the absence or presence of Kap121, (D) Nic96 and 53core or equimolar 53core:Kap121 or 157N:53core:Kap121 mixtures, and (E) Nic96 and 53core or its equimolar mixture with HsKapβ1. The ITC binding profiles were analyzed by a single-site 1:1 binding model (continuous lines; best-fit parameters with SDs are reported in Table 1). (F) 3D population distribution plot of the 53core·Kap121·Nic96 complex. Increasing Kap121 concentration gradually destabilizes the 53core-Nic96 interactions—at a 1:1 ratio of 53core and Nic96, the fractional population of the 53core·Nic96 complex decreases from ~0.6 to 0.3 as the [Kap121]/[Nup53] molar ratio increases from 0 to 2. NS-EM models of 53core·Kap121 (gray) and 53core·Kap121·Nic96 (green) at a stoichiometry ratio of 2:2 are shown in top view with fitted crystal structures of Kap121 and the Nup53 RRM domain. Dashed ovals denote electron density differences between binary and ternary complex.
