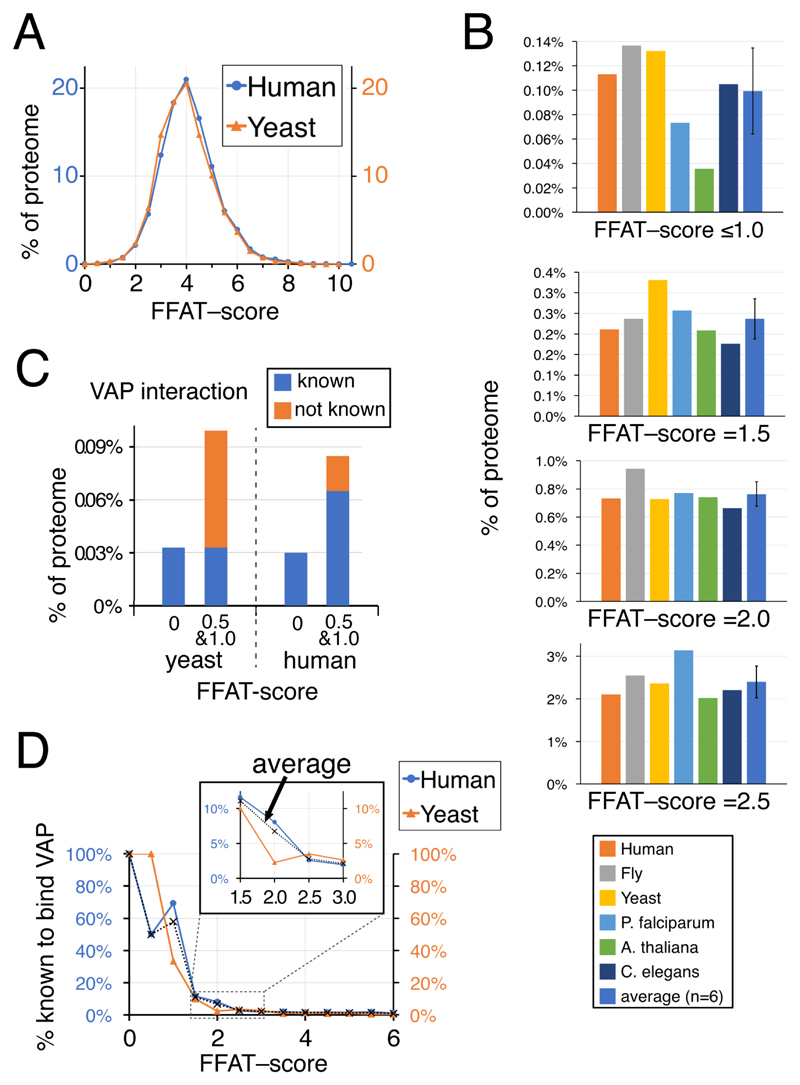
Figure 2. Three percent of eukaryotic proteins have FFAT scores ≤2.5.
(a) Distributions of FFAT scores in human and yeast (S. cerevisiae). FFAT scores are assigned as described in Methods. The means and standard deviations are yeast: 4.6±1.1, human 4.5±1.1; the distributions are statistically similar (Chi2 0.998). B. Proportion of 6 eukaryotic proteomes at different levels of low FFAT score, from highly optimal (top, range 0.0 – 1.0) to less optimal (bottom, =2.5), including the average, un-weighted for number of proteins in each proteome, and standard deviation. C. Proportions of yeast and human proteins with motifs with highly optimal FFAT scores (range 0.0 – 1.0) showing if they are known interactors of VAP. D. Proportion of proteins identified as binding VAP in yeast and human according to their FFAT scores (range 0.0 – 6.0). Inset shows detail in the range FFAT scores 1.5 – 2.5. Dotted lines indicate the average across the two species. Identification of proteins as VAP interactors declines rapidly as FFAT score increases: 59% for FFAT score ≤1.0 (human 11/17, yeast 2/5); 8% for 1.0<FFAT score≤2.0 (human 17/180, yeast 3/62); and 3% for 2.0<FFAT score≤3.0 (human 11/440, yeast 5/146).

