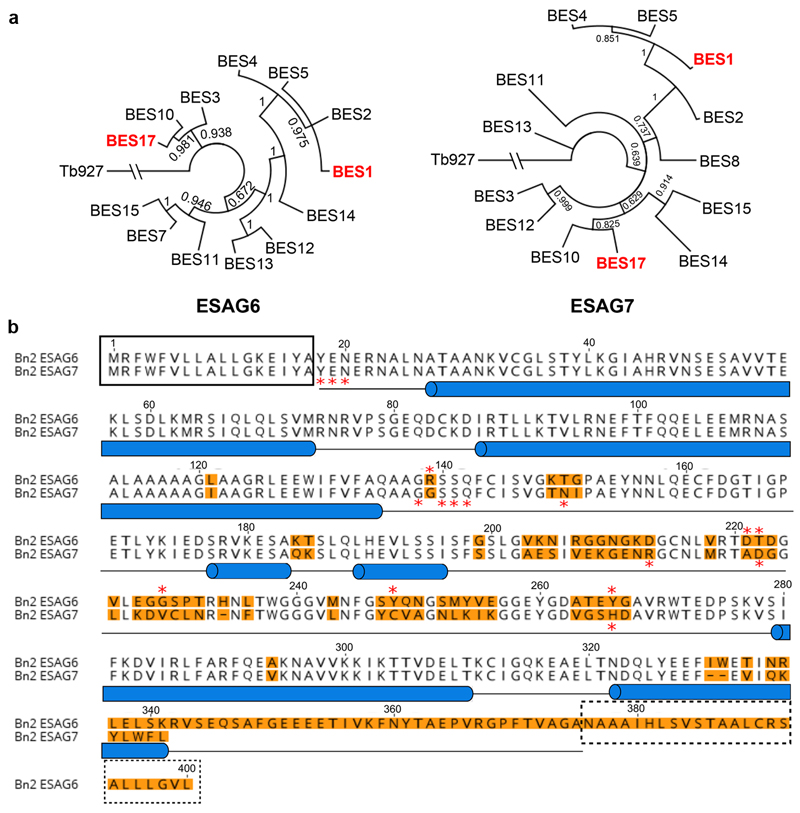
Extended Data Figure 1. Phylogenic analysis of transferrin receptors.
A. Evolutionary trees showing the relatedness of different transferrin receptor variants within the blood stream expression sites of the Lister 427 strain. The BES1 and BES17 receptors are highlighted in red. B. Comparison of the BES17 ESAG6 and ESAG7 proteins. The black box indicates the signal sequence and the dashed black box indicates the GPI-anchor addition site. Blue cylinders represent the helical regions of the structure. Red stars mark residues which make direct contacts with human transferrin. Orange highlighting of the text indicates residues which differ between ESAG6 and ESAG7.

