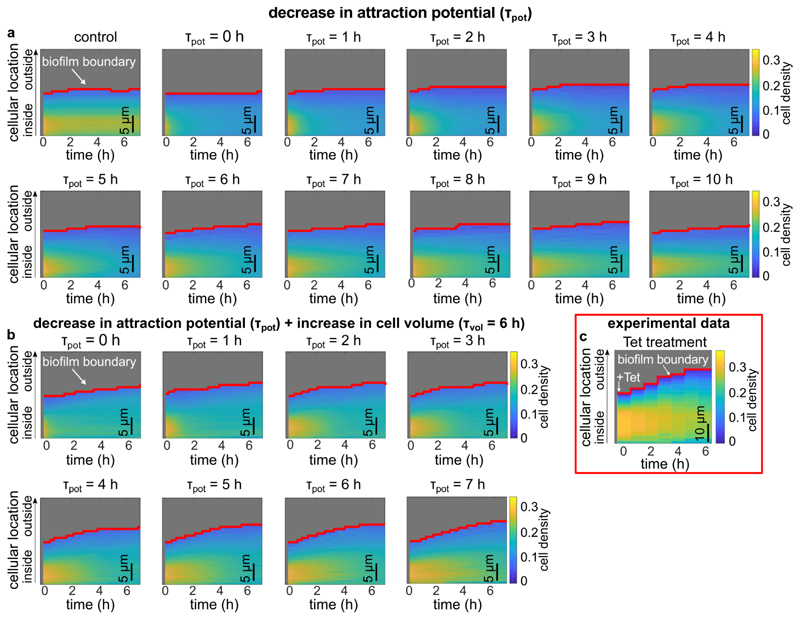
Extended Data Fig. 8. Simulated biofilms were subjected to a decrease in cell-cell attraction and an increase in cell volume, revealing the contribution of each effect to the antibiotic-induced biofilm architecture changes.
Biofilm growth was simulated as described in the methods section until the biofilm size reached 1,000 cells, corresponding to the 0 h time point in the heatmaps in this figure. For these 1,000-cell biofilms, tetracycline treatment was simulated by decreasing the attraction potential, or by increasing the cell volume, or by both effects together. (a) Kymograph heatmaps of simulated 1,000-cells biofilms subject to a linear decrease in cell-cell attraction over the course of different times ⊺pot. The value of ⊺pot corresponds to the time for the cell-cell attraction potential to decrease to zero, starting from the value used to simulate biofilm growth. If the attraction potential is set to zero immediately (corresponding to ⊺pot = 0), the resulting biofilm dynamics do not closely resemble the experiments, indicating that the cell-cell attraction decreases over an extended period of time. The control kymograph heatmap corresponds to biofilms were neither the attraction potential or the cell volume were changed. Each heatmap is the average of n = 3 simulations. (b) Heatmaps of simulated 1,000-cells biofilms that were subjected to a decrease in cell-cell attraction over different times (⊺pot) and simultaneously subjected to a linear increase in cell volume over 6 h (⊺pot = 6 h). Each heatmap is the average of n = 3 simulations. In Fig. 3h of the main text, a kymograph heatmap is shown for simulations in which only the cell volume is linearly increased with a time scale ⊺vol = 6 h, according to the experimentally determined single-cell volume growth rate during Tet-treatment. (c) Experimental changes of the average cell density as a function of space and time during tetracycline treatment inside the biofilm as shown in Fig. 1g, reproduced here for convenience. Heatmap in panel c is a representative of n = 5 different biofilms.

