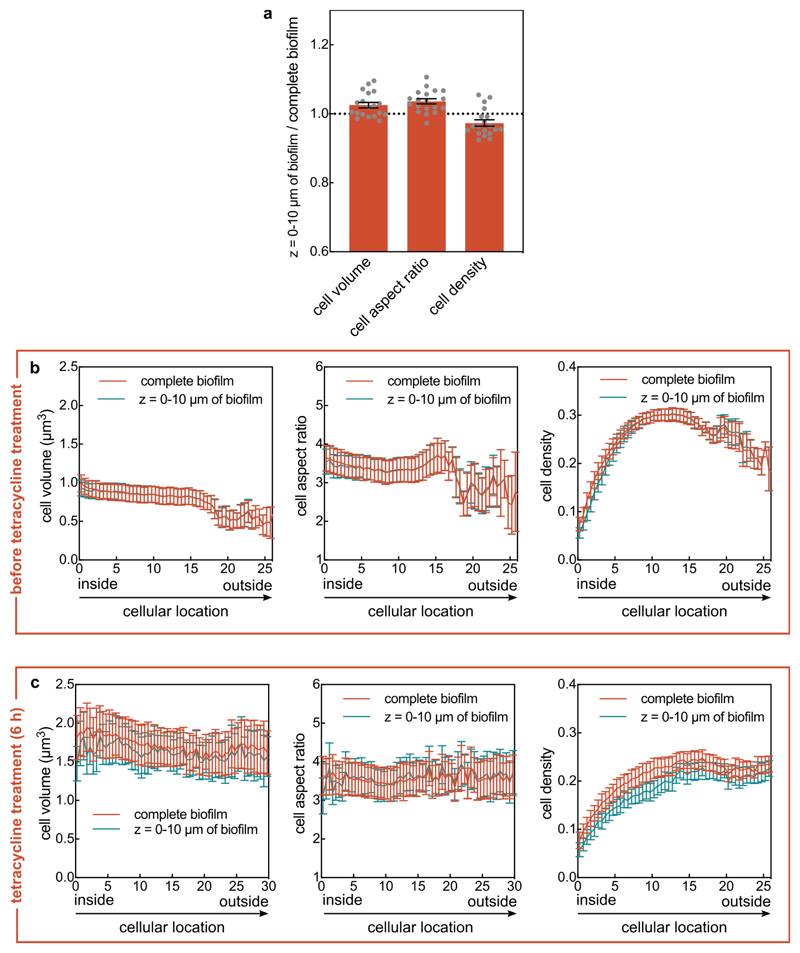
Extended Data Fig. 10. Biofilm architecture in the lower part of the biofilm is representative of the whole biofilm.
(a) Comparison between the cell volume, cell aspect ratio, and cell density (measured as volume fraction) between the lower part of the biofilm and the whole biofilm. The ratio of these biofilm architecture parameters was calculated using the mean value of these parameters in the part of the biofilm that is bounded by the z = 0 μm and z = 10 μm planes, and the mean value of these parameters in the whole biofilm (mean ± SEM, n = 19 different biofilms). (b, c) Cell volume, cellular aspect ratio, and cell density before tetracycline treatment (panel b) or after 6 hours of tetracycline treatment (panel c) as measured for complete biofilm volumes, or for the cells located in the biofilm volume bounded by the z = 0 μm and z = 10 μm planes (mean ± SD, n = 8 samples in panel b and n = 5 samples in panel c; each sample corresponds to a different biofilm). The cellular location was measured as the shortest distance of each cell to the interface between the biofilm and the liquid growth medium. This interface is termed “biofilm boundary” in this manuscript. For the experiments in this figure, biofilms were stained with the nucleic acid dye SYTO 9 prior to imaging. The cell volume, aspect ratio, and cell density were nearly identical between the whole biofilm and the bottom-most 10 μm of the biofilms.

