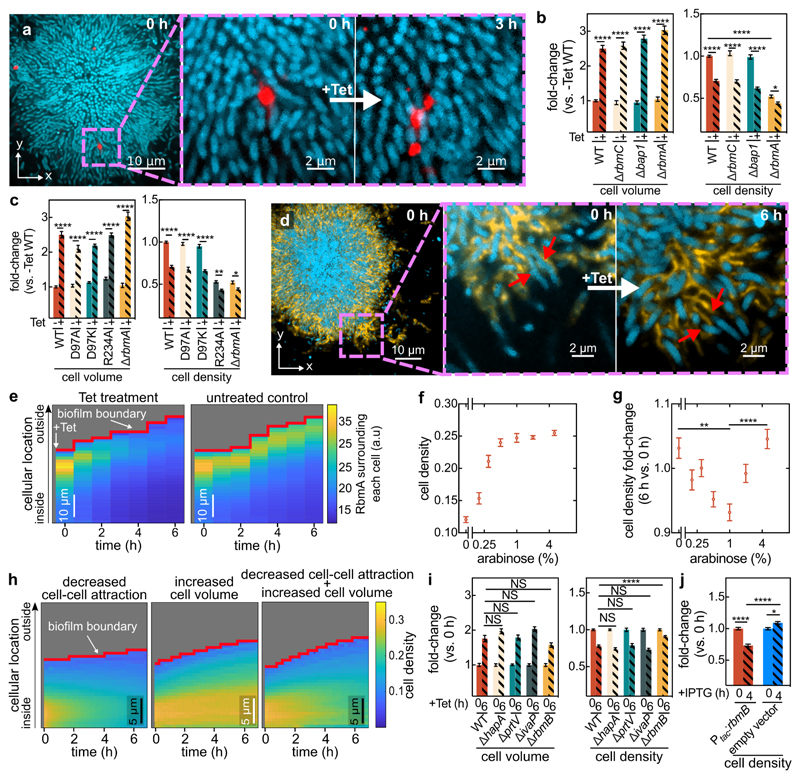
Figure 3. Antibiotic-induced architectural breakdown of biofilms.
(a) Matrix movement during antibiotic-treatment is visualized by fluorescent beads attached to the matrix. Cells expressing the sfGFP fluorescent protein (shown in cyan) were grown in medium containing fluorescent beads of diameter 0.1 μm (red). Occasionally, beads incorporated into the biofilm matrix. During Tet treatment, no new beads entered the biofilm. Magnified inset shows the separation of the red bead-cluster during tetracycline treatment, revealing differential movement in the matrix. Images are representative of n = 3 different biofilms. (b) Cell volume and cell density (measured as volume fraction) fold-changes of biofilms of matrix-protein deletion mutants in comparison to untreated biofilms. Data shown as mean ± SEM, n = 15, 9, 10, 10, 15, 8, 18, 11 for WT (-Tet), WT (+Tet), ∆rbmC (-Tet), ∆rbmC (+Tet), ∆bap1 (-Tet), ∆bap1 (+Tet), ∆rbmA (-Tet), ∆rbmA (+Tet) respectively; samples correspond to different biofilms. (c) Cell volume and cell density fold-changes of RbmA mutants (RbmA-D97A, D97K, R234A) with different conformations of RbmA structure. Data shown as mean ± SEM, n = 15, 16, 19, 19, 10, 18, 11 for WT (-Tet), WT (+Tet), D97A (-Tet), D97A (+Tet), D97K (-Tet), D97K (+Tet), ∆rbmA (-Tet), ∆rbmA (+Tet), respectively; samples correspond to different biofilms. (d) During antibiotic exposure cells (labelled cyan, using mTFP1) separate from the matrix (labelled yellow, using a fluorescent antibody against RbmA-His). Magnified inset shows individual cells detaching from RbmA during Tet treatment (indicated by red arrows, which show the same region of the biofilm in both panels). Images are representative of n = 5 different biofilms. (e) Heatmaps show the average RbmA-His immunofluorescence surrounding each cell, as a function of time and cellular distance from the biofilm boundary, for Tet-treated (left) and untreated control (right) biofilms. Heatmaps are representative of n = 5 different biofilms. (f) Cell density of ∆rbmA PBAD:rbmA biofilms as a function of arabinose concentration. Data shown as mean ± SEM, n = 7, 12, 11, 16, 10, 18, 14 samples for arabinose concentrations of 0%, 0.2%, 0.3%, 0.5%, 1%, 2%, 5%, respectively; samples correspond to different biofilms. (g) Cell density fold-change (comparing 6 h and 0 h of Tet treatment) of biofilms grown from the ∆rbmA PBAD:rbmA strain, as a function of arabinose concentration. Data shown as mean ± SEM, n = 5, 12, 11, 16, 10, 18, 14 samples for arabinose concentrations of 0%, 0.2%, 0.3%, 0.5%, 1%, 2%, 5%, respectively; samples correspond to a different biofilms. (h) Heatmaps of simulated biofilms that were subject to a linear decrease in cell-cell attraction over 7 h (left panel), a linear increase in cell volume over 6 h (middle panel) or both effects in combination (right panel), n = 3 simulation runs. (i) Fold-changes in cell volume and cell density of tetracycline-treated biofilms grown from strains that lack proteases that are involved in the processing of the matrix protein RbmA (∆hapA, ∆prtV, ∆ivaP), or the enzyme RbmB (mean ± SEM, n = 17, 8, 16, 3, 15 for WT, ∆hapA, ∆prtV, ∆ivaP, ∆rbmB, respectively). (j) Fold-changes in cell density of WT biofilms carrying the Ptac:rbmB construct on a plasmid or an empty vector, in the presence of IPTG induction (mean ± SEM, n = 16 for Ptac:rbmB, n = 11 for empty control). For panels i-j each sample corresponds to a different biofilm. Statistical significances were calculated using a one-way ANOVA with Bonferroni’s correction. Statistically non-significant differences (NS) in panel i correspond to p = 0.43, 0.99, 0.59, 0.34, 0.99, 0.99, 0.99 (left to right). *, **, ***, and **** indicate p <0.05, <0.01, <0.001, and <0.0001 respectively. Images in panels a and d were acquired 2 μm above the coverslip.

