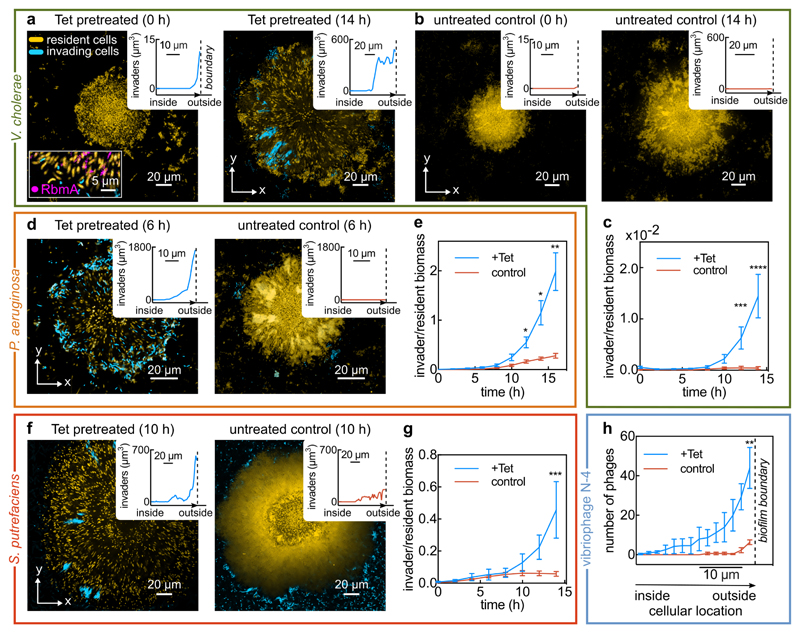
Figure 4. Antibiotic-treated biofilms are susceptible to colonization and invasion.
(a) Confocal xy-slices of a resident V. cholerae WT biofilm, expressing mKOκ constitutively (cells shown in yellow). The resident biofilm underwent tetracycline (Tet) treatment for 6 h, followed by 2 h exposure to invader cells (shown in cyan), which are isogenic except for the fluorescent protein they express (sfGFP instead of mKOκ). Following exposure to planktonic invader cells, the medium was exchanged to fresh, sterile medium and the imaging was started (labelled 0 h here). The inset at 0 h shows a biofilm colonized by cyan cells in which RbmA is visualized using immunofluorescence (magenta). Another inset shows the location where planktonic cells have colonized the resident biofilm, measured as a distance from the biofilm boundary. Replicate experiments are shown in Extended Data Fig. 9a-b. Cyan cells colonize the inside and periphery of biofilms, but rarely attach to the glass surface. (b) Confocal xy-slices of a control biofilm (not treated with tetracycline) exposed to V. cholerae invader cells for the same duration. Very few cells attach to the glass surface, and none to the resident biofilm, as described in the methods section. Images in panels a in b are representative of 8 different biofilms. (c) Quantification of invader biomass divided by resident biomass during a V. cholerae biofilm population invasion; mean ± SE, n = 8 for +Tet and n = 11 for control conditions. (d) Confocal xy-slice of a Tet-treated or control resident V. cholerae biofilm invaded by P. aeruginosa, following the same protocol as for panel a. Images are representative of 12 different biofilms. (e) P. aeruginosa invader biomass normalized by V. cholerae resident biomass; mean ± SE, n = 12 for +Tet and n = 11 for control conditions. (f) Confocal xy-slice of a Tet-treated or control resident V. cholerae biofilm invaded by S. putrefaciens, following the same protocol as for panel a.Images are representative of 8 different biofilms. (g)S. putrefaciens invader biomass normalized by V. cholerae resident biomass; mean ± SE, n = 12 for +Tet and n = 8 for control conditions. (h) Quantification of number of vibriophage N-4 virions as a function of position, for Tet-treated biofilms and untreated control biofilms, after 6 h of phage exposure; means ± SE, n = 5 for +Tet and n = 3 for control conditions. Images of phage invasion of biofilms are shown in Extended Data Fig. 9c. Images shown in panels a, b, d, f were acquired 2 μm above the substrate. Sample sizes (n) correspond to different biofilms. Statistical significances were calculated using a two-way ANOVA with Bonferroni’s correction. *, **, ***, and **** indicate p <0.05, <0.01, <0.001, and <0.0001 respectively.

