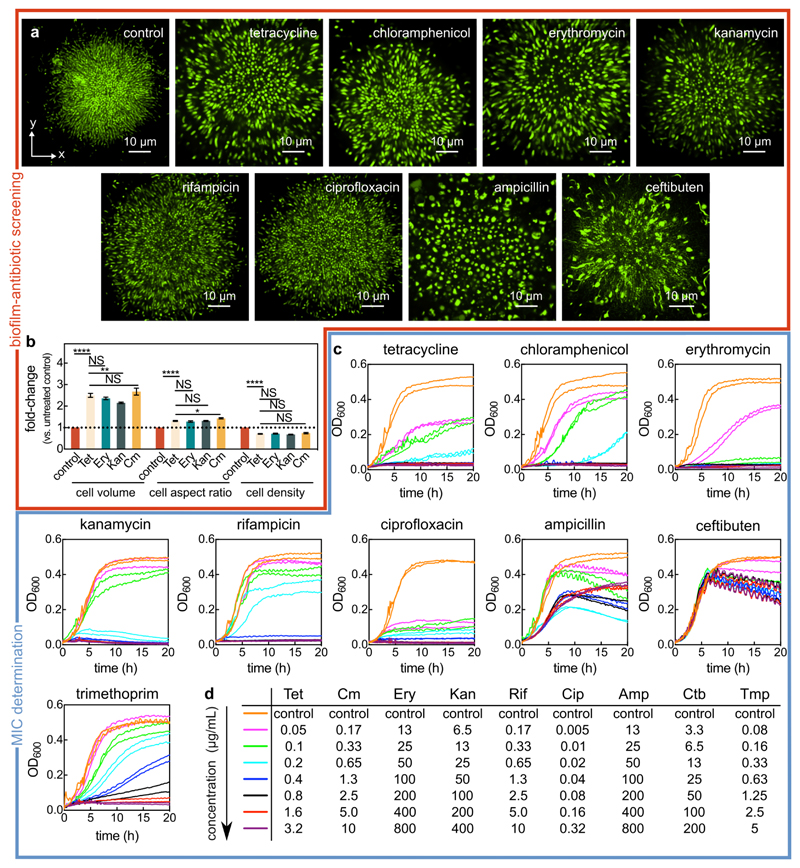
Extended Data Fig. 1. Screening biofilm architecture after antibiotic exposure and identifying the minimum inhibitory concentration (MIC).
(a) Confocal xy-slices of biofilms exposed to different antibiotics for 24 h and stained with the SYTO 9 nucleic acid dye. The conditions tests were the following: untreated control biofilm, tetracycline (Tet; 3 μg/mL, 8x the MIC), chloramphenicol (Cm; 10 μg/mL, 8x the MIC), erythromycin (Ery; 200 μg/mL, 4x the MIC), kanamycin (Kan; 200 μg/mL, 4x the MIC), rifampicin (Rif; 6 μg/mL, 5x the MIC), ciprofloxacin (Cip; 0.5 μg/mL, 6.3x the MIC), ampicillin (Amp; 400 μg/mL, a concentration at which the cell morphology was significantly modified), and ceftibuten (Ctb; 50 μg/mL, a concentration at which the cell morphology was significantly modified). Images are representative of n = 3 independent experiments. (b) Fold-change of cell volume, cell aspect ratio, and cell density (calculated as volume fraction) of biofilms treated with different protein synthesis inhibitors for 6 h, relative to untreated biofilms (mean ± SEM, n = 15 samples for control, n = 9 for Tet, n = 7 for Ery, n = 14 for Kan, and n = 8 for Cm; samples correspond to different biofilms). Statistical significances were calculated using a one-way ANOVA with Bonferroni’s correction. Statistically non-significant differences (NS) correspond to p = 0.93, 0.51, 0.99, 0.99, 0.99, 0.99, 0.46 (left to right). *, ** and **** indicate p < 0.05, p < 0.01 and p < 0.0001 respectively. (c) Batch culture growth curves of wild-type V. cholerae N16961 grown in M9 medium supplemented with glucose and with different antibiotic concentrations. Every line corresponds to the average between 2 technical replicates, and each concentration has been tested on 2 separate days (each resulting in one line). For ampicillin and ceftibuten, the MIC determination was not possible from the concentrations tested, due to the lack of cell lysis. (d) List of antibiotic concentrations used in panel c according to their color-coding.

