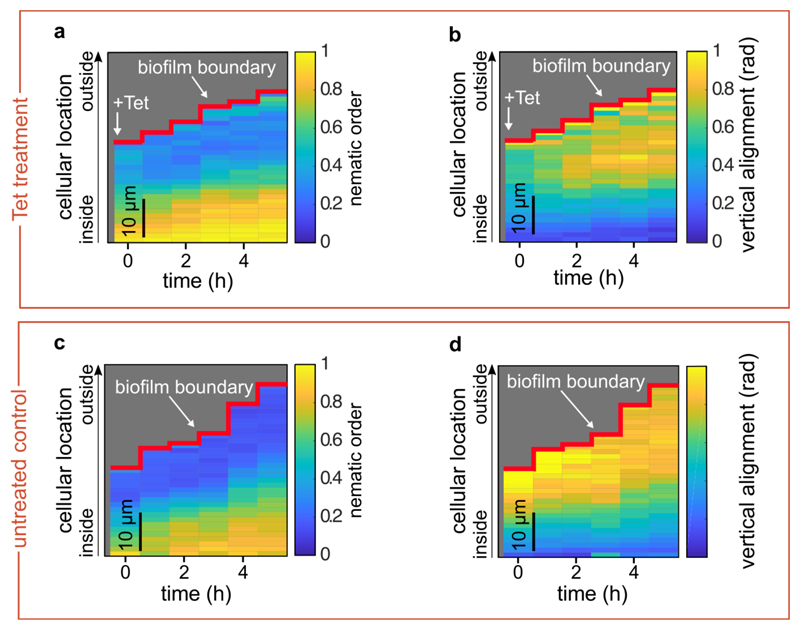
Extended Data Fig. 2. Nematic order and vertical alignment of cells in biofilms during tetracycline treatment, compared with untreated controls.
(a, b) Spatiotemporal changes of the average nematic order (a), or the vertical alignment (b), as a function of time and position inside the biofilm during tetracycline treatment. Each pixel in the heatmap is coloured according to the average nematic order (a) or vertical alignment (b) at a given time and spatial position in the biofilm. (c, d) Spatiotemporal changes of the average nematic order (c), or the vertical alignment (d), for control biofilms that were not treated with tetracycline. In these kymograph heatmaps, the pixel values correspond to averages over all cells with similar distances from the surface of the biofilm at a particular time. Heatmaps are representative of n = 5 different biofilms.

