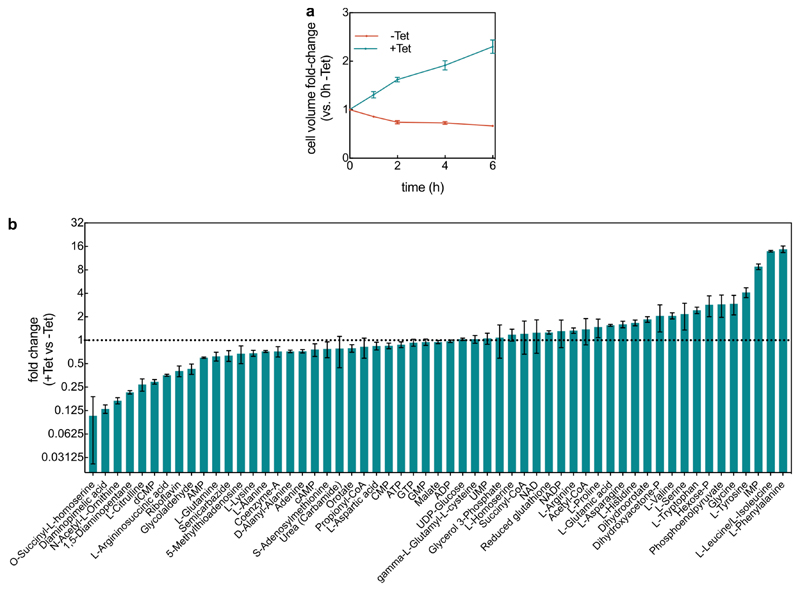
Extended Data Fig. 5. Changes in cell volume and metabolite levels of planktonic cells during exposure to tetracycline.
(a) Cell volume fold-change (comparing each time point to the untreated (-Tet) sample at 0 h (mean ± SEM, n = 5 independent biological replicates. (b) Fold-changes in 57 metabolites after 2 h of Tet treatment in comparison with untreated cells (mean ± SEM, n = 3 independent biological replicates).

